'Data to Delivery in an Hour With Jaspersoft': A Guide
Applications with embedded reporting and analytics allow end-users to gain fresh insights and create customizable data visualizations inside an interface users are familiar with. However, embedding these convenient features into an application can be complex and time-consuming. Even highly experienced developers may spend several days integrating authentication and the user interface, which can drive up costs and slow development.
Jaspersoft streamlines this process by offering a customizable platform for designing, managing, and delivering reports. Developers can integrate this reporting and analytics solution in any application, eliminating the need to design a custom tool from scratch.
This guide covers how to get started with Jaspersoft and how to use Visualize.js to deliver visualizations inside your application. By following our simple steps, you can transform your data into an interactive report embedded inside your application in an hour or less.
What is Jaspersoft?
Jaspersoft has everything you'll require to design and deliver any report you need.
Designed to be flexible, developer-friendly, and able to scale to meet the needs of organizations of all sizes, Jaspersoft is a customizable reporting and analytics platform that allows businesses to create, embed, and manage data visualizations and reports with pixel-perfect precision.
It's available in two editions—commercial and community—and organizations can review this guide to choose the one that’s right for their unique needs.
How to design reports with Jaspersoft
Jaspersoft offers multiple tools for designing reports. This guide will cover:
Jaspersoft Studio: This robust report designer allows users to create highly formatted, pixel-perfect designed reports and data visualizations and can pull from the broadest selection of data sources. It is available as a desktop tool or via web application.
Ad Hoc Designer: This web-based, drag-and-drop report designer has an intuitive user interface to put your end users in the driver’s seat.
Dashboard Designer: This web-based user interface allows users to compile dashboards with pre-existing elements and create new visualizations that make sense of important information quickly and easily.
How to deliver reports with Jaspersoft
This guide will deliver the visualizations using Visualize.js. However, Jaspersoft provides several ways to deliver and distribute reports including:
JasperReports Library: This open-source Java reporting engine allows users to generate and deliver reports within Java applications.
Rest API: Clients can use this interface to interact with JasperReports Server to run, export, and schedule reports.
JasperReports Server UI: Users can create reports with the Ad Hoc reporting interface and arrange them into insightful dashboards.
Visualize.js: This JavaScript API framework allows developers to seamlessly embed interactive data visualizations and reports directly into web applications.
What you need to get started
Before you start designing your report, complete the following prerequisite tasks:
Download and install JasperReports Server and Jaspersoft Studio on your computer.
Gather connection information for your data sources.
Consider brushing up on your knowledge of web development, banded report design, JavaScript, and SQL.
Create a webpage where you will embed the data visualization.
Prepare content for your dashboard.
Let's get started
Follow these simple steps to design and deliver an interactive dashboard inside a web page with the Jaspersoft commercial edition:
1. Connect to the data
Use the dropdown menus to identify the type of data source, insert the database name, and enter your user credentials. The JasperReports Server will automatically generate a data source URL, which you should copy for later use.
To do this:
Log into the JasperReports Server.
Use the menus to navigate to "Create" and then to "Data Source."
Use the dropdown menus to identify the type of data source, insert the database name, and enter your user credentials. Alternatively, you can enter the URL.
Test the connection.
Save the data source.
You'll also need a data connection in the desktop designer. To do this, open Jaspersoft Studio and follow these steps:
In the “Repository Explorer,” right-click and select “Create a Data Adapter."
Select “Database JDBC adapter.”
Select the type of database.
Enter the data source URL username and password to establish a connection to your database.
Test the connection.
Save the adapter.
2. Create a detailed report
In Jaspersoft Studio:
Within the “File” menu, click “New,” and select “JasperReport.”
Choose a pre-built template or create your own report format.
Name the report and click “Next.”
Select your data adapter created above and create a query to retrieve your detailed data, and then click "Next."
Select "Finish" to generate the report.
Modify the report as desired:
Add input parameter and use the parameter in the query.
Customize any properties, such as modifying the report title and subtitle.
Format column headings, such as positioning, padding, formatting, etc.
Click the "Preview" tab to view the report.
Publish the report to the server, selecting the data source from the server when prompted.
3. Build a domain on top of the data
Domains are structures for managing data in the JasperReports Server. They connect to a normal data source and select tables and columns, join them to others, arrange the results into business-related sets, give them meaningful labels, and provide access security based on users and roles.
To build a domain:
Use the menus to navigate to "Create" and then to "Domain."
Select your data source.
Within the “Data Management” tab, select the schema and tables you want included in the domain.
Within the “Joins” tab, create the connections/associations between the tables.
Within the “Data Presentation” tab, build the structure that the ad-hoc user/report designer will see. This includes labels, descriptions, usage, and data formatting.
In addition, you can add security and localizations, although these are more advanced actions.
Save the domain.
4. Create a summary view of the data
To create your summary view:
Click "Create" and then "Ad Hoc View."
Choose the domain.
Select the visualization type.
Use the drag-and-drop interface to insert data into rows and columns needed for the visualization type.
Add a filter as needed to display a subset of the data.
Use the “Format” panel to customize the visualization format.
Save the ad hoc view.
Users can also change the visualization type and add filters to explore the data from different perspectives.
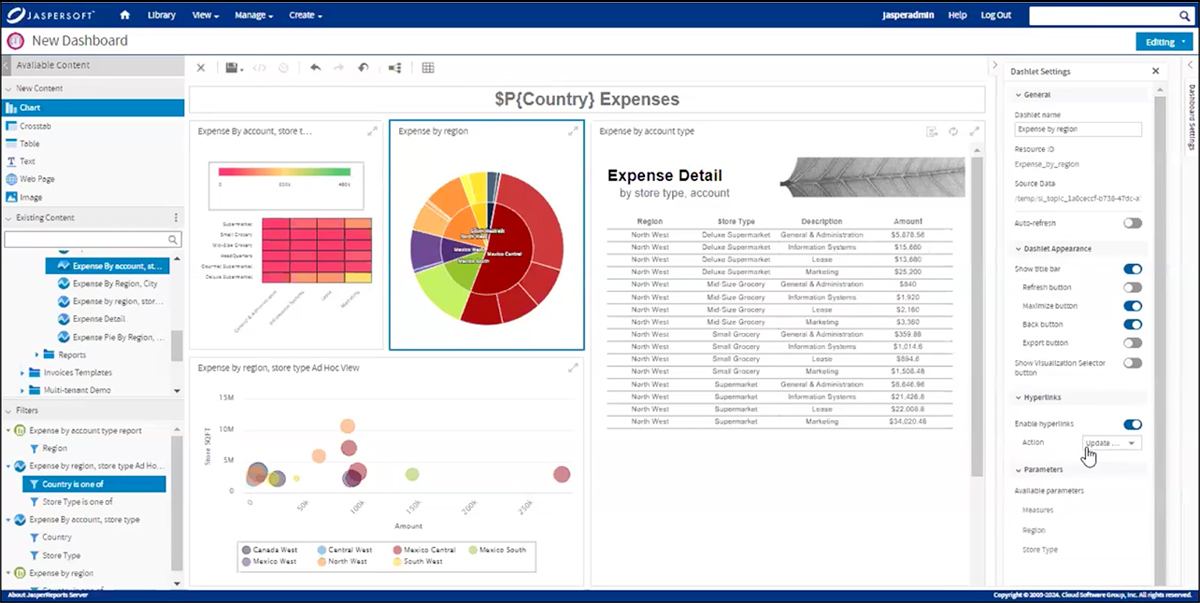
5. Tie the data visualizations together in a dashboard
To tie in the data visualizations:
In the "Create" menu, select "Dashboard."
Add a "Text" component at the top.
Add several reports to the dashboard, including the ones created above.
Modify the "Dashlet" properties for the added reports, such as adding buttons, controlling responsiveness, and enabling hyperlinks where needed.
Optionally, input controls can be added to the dashboard to control the individual reports.
If desired, create a filter to feed information from the application to the dashboard.
Create a new chart on the fly.
Enable the hyperlink on the chart.
Use the "Parameter mapping" dialog to tie events and filters to components either within the dashboard or external navigation.
Use the "Dashboard Settings" panel to customize the formatting.
Save the dashboard.
6. Add the dashboard to a web page
Save the completed dashboard to the Repository and click the "Get Embed Code" button. Paste this code into the web page’s HTML code for basic embedding. This includes:
The location of the Server's Javascript
Javascript to establish security
Javascript to generate the dashboard
Additional Javascript can be used to implement advanced features, including input controls, further navigation, and interactivity.
Execute the webpage to see the embedded dashboard live in the application.
Other services Jaspersoft provides
Beyond embedding reports, Jaspersoft delivers value with these features:
Integrated Security: JasperReports Server uses authentication methods and data-level security to protect confidential data and control access permissions.
Multitenancy: Jaspersoft allows you to easily manage multiple groups of users and customers from a single console.
Scalability: The cloud-native platform allows developers to scale up reporting by adding more data sources and distributing reports to more users.
Input Controls: Robust filters allow users to customize report outputs.
Get started with embedded reporting
This basic guide only scratches the surface of Jaspersoft’s sophisticated reporting and analytics capabilities. Begin a free 30-day trial today to explore the platform’s reporting tools, or contact us for more information.
You can also view our on-demand webinar (42:07) for a detailed guide to designing reports with Jaspersoft.
Try Jaspersoft for free for 30 days
Efficiently design, embed, and distribute reports and dashboards at scale with Jaspersoft.
Related Resources
Monthly Live Demos with Q&A
Hosted by our Solutions Engineers every third Wednesday of the month
Data to Delivery in an Hour With Jaspersoft
Enjoy this practical webinar where we go from data to delivery in under an hour using Jaspersoft, demonstrating everything from data connectivity, visualization and report design, to implementation on a web page.
Dr. Jaspersoft: Embed Your Analytics with Visualize.js
Unlock the power of embedded analytics with Jaspersoft and discover how to seamlessly integrate analytics into your platform using the Visualize.js framework. This webinar demonstrates efficient practices and features that will help you to transform your data into actionable insights with ease!