Self-service reporting for everyone
Put your users in the driver’s seat by giving them the control to create their own custom dashboards, analytics and reports. With Jaspersoft’s intuitive, web-based, drag-and-drop report designer, you can place the power in their hands.
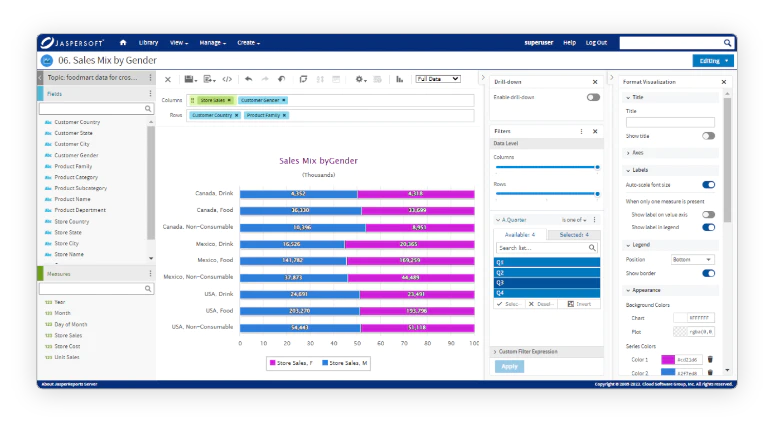
Users can slice, dice, and create compelling data visualizations and reporting whenever they need it. No application download required.

Enable your users to create stunning data visualizations and insightful reports, all on their own
Powerful reporting interface
Jaspersoft’s Ad Hoc Designer has an interactive user interface that supports drilling, pivoting, filtering and interactive charting. Use dozens of powerful built-in calculations to quickly perform advanced reporting on your data.
Fully interactive charts
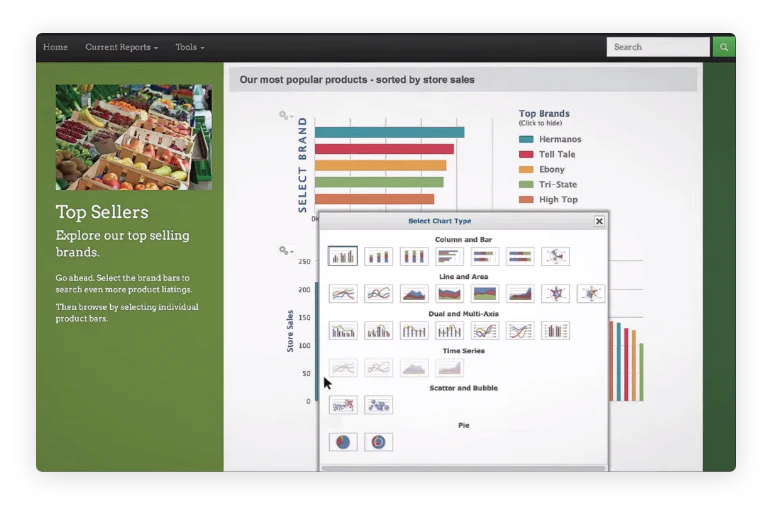
Using Highcharts, Jaspersoft offers more than 35 HTML5 visualizations for users to select from. View in a tabular view with tables and crosstabs, or use charts and graphs for a more visual experience.
Simple save and export functionality
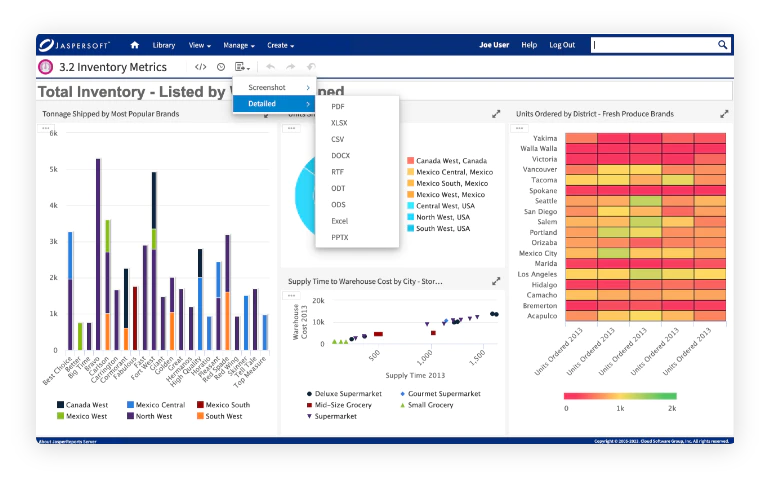
Easily save a custom report or visualization to the Jaspersoft repository for later use. Export to more than 10 file formats including PDF, Excel, PPT, Word and more.

Configurable in-memory engine
Maximize response times for data aggregations and calculations using configurable in-memory or push-down query processing to the underlying analytic database.
Open architecture
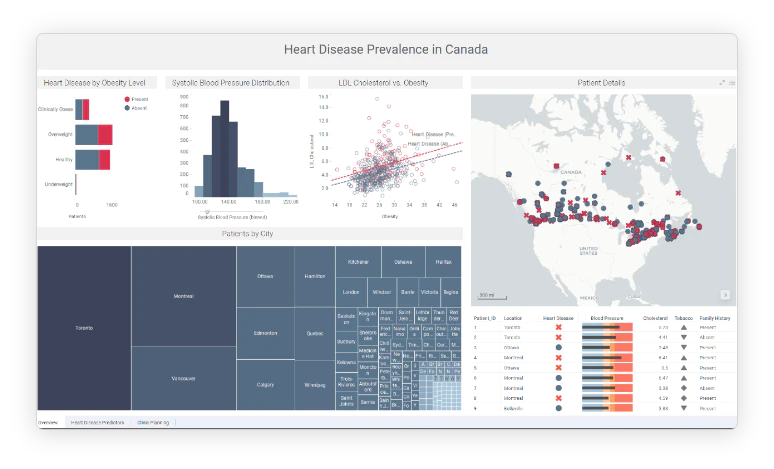
Easily integrate your reports into existing infrastructure with Jaspersoft's open standards-based reporting platform. Merge data from multiple sources flexibly from traditional to big data.
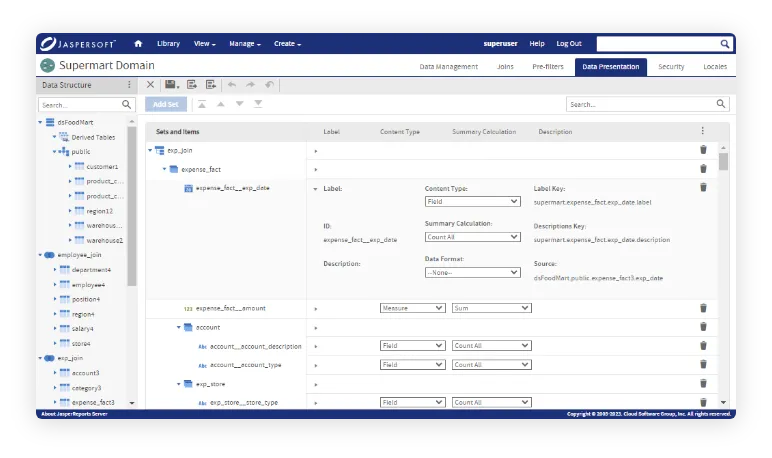
Metalayer
Re-name data descriptors in easily understandable terms for business users using a metalayer. Simplify the data with a virtual view in business terms while maintaining data security. Include labels in multiple languages to support a broader user community.

Enhance quicker decision-making for government workers
With embedded analytics and ad hoc reporting, governmental organizations can be on top of critical issues easier, manage operations more effectively, and stay compliant with rules and regulations.

See all that Jaspersoft has to offer

Live Demo with Q&A
See key features in action.
Get answers to your questions.
Hosted by our Solutions Engineers.
Ready to give it a spin?
Start your 30-day trial now.