



Mastering embedded analytics: Where Jaspersoft outperforms its competitors
In today’s rapidly evolving world, businesses are moving beyond dull, static dashboards toward dynamic data visualizations and integrated user experiences. In our webinar, Mastering Embedded Analytics: How to Drive Interactivity and Value (45:11) , Jaspersoft engineers shared how their unique approach to pixel-perfect reporting and flexible embedding sets them apart from other BI solutions in the market.
Why Jaspersoft?
For Thomas Tibcken, a solution engineer at Jaspersoft, pixel-perfect reporting is not just about making "fancy" documents; it is about the high-level logic and industrial precision that modern businesses require.
Through his presentation, he tells a story of how these reports evolve from static files into powerful, flexible business tools across three levels of detail:
Level 1: The core—precision and compliance
Thomas explains that "pixel-perfect" first sounds like a static, boring document. However, the reality is that these reports often have strict regulatory standards behind every pixel.
Business impact: In manufacturing, this level of detail is mission-critical. For example, Jaspersoft can precisely place barcodes on shipping labels so that warehouse robots can pick up and move palettes to exact positions. A shift of even a few pixels could cause a total operational failure.
Level 2: The logic—extreme flexibility
Moving deeper, Thomas highlights that Jaspersoft allows developers to add logic and parameters directly into the report template using "Print When" expressions.
Business impact: This creates "Massive Template Scalability". Instead of building 50 different reports for different departments, a company can use one template that dynamically hides or shows bands, charts, tables, or text based on user input. This reduces maintenance costs and simplifies the user experience.
Level 3: The integration—the "invisible machine"
Finally, Thomas describes Jaspersoft as an "invisible machine" that acts as an execution engine behind the scenes of a business’s own software.
Business impact: This allows companies in the financial, healthcare, or public sectors to power complex data operations without ever forcing the user to leave their branded application. By using APIs like Visualize.js, businesses can embed these high-precision reports so they feel like a native, "fancy" part of the product while the Jaspersoft engine handles the heavy lifting in the background.
If you are in EMEA, contact us to book a meeting with Thomas or another member of our team to talk about your use case and how Jaspersoft can help with complex design and delivery needs.
Jaspersoft pixel-perfect reporting bridges the gap between simple data visualization and functional business automation. It allows businesses to scale quickly, remain compliant, and provide high-value interactivity without increasing technical debt.
Three ways to embed: Speed vs. control
The webinar outlines several embedding options, providing developers with versatile pathways to integrate analytics. These choices allow teams to align their strategy with specific organizational goals and technical requirements:
- The quick win using an iFrame approach
This is the fastest way to embed, using a standard HTML iFrame to point to a JasperReports Server URL. It’s ideal for teams needing to go live in minutes with a view that mirrors the JasperReports Server exactly. - Powerful Javascript integration (Visualize.js)
Using the Visualize.js JavaScript API, developers can embed reports and input controls as independent elements. This allows for a "low maintenance" approach where Jaspersoft handles security patches and API updates while providing a more integrated feel than an iFrame. - Deep customization (custom UX)
For projects requiring "Application Synergy," Visualize.js allows developers to build completely custom UIs using frameworks like React. This approach offers 100% control over the user interface, making the analytics feel like a native part of the application rather than an external plugin.
Strategic advantage: Scaling without commitment
A key insight from the webinar is that Jaspersoft doesn't force an "either-or" choice. A company can launch an MVP quickly using standard iFrame components and then scale into a fully customized, high-performance integration as user feedback demands—all using the same underlying resources.
For businesses looking to transition from standard BI to true embedded intelligence, Jaspersoft 10.0 offers a trial period to explore these architectural advantages firsthand.
Watch the full webinar (45:11) to see the demos or contact us to discuss your use case.
Ready to give it a spin?
Start your 30-day trial now.

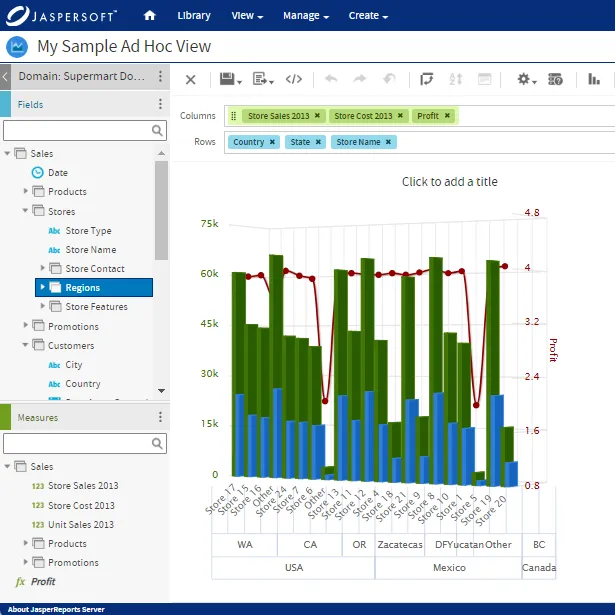
Try Jaspersoft - Free Trial
Efficiently design, embed, and distribute reports and dashboards at scale with Jaspersoft.
Build versus Buy: An In-depth Guide
This whitepaper provides a framework for the decision-making process and critical trade-offs between building or buying an embedded BI and reporting tool.
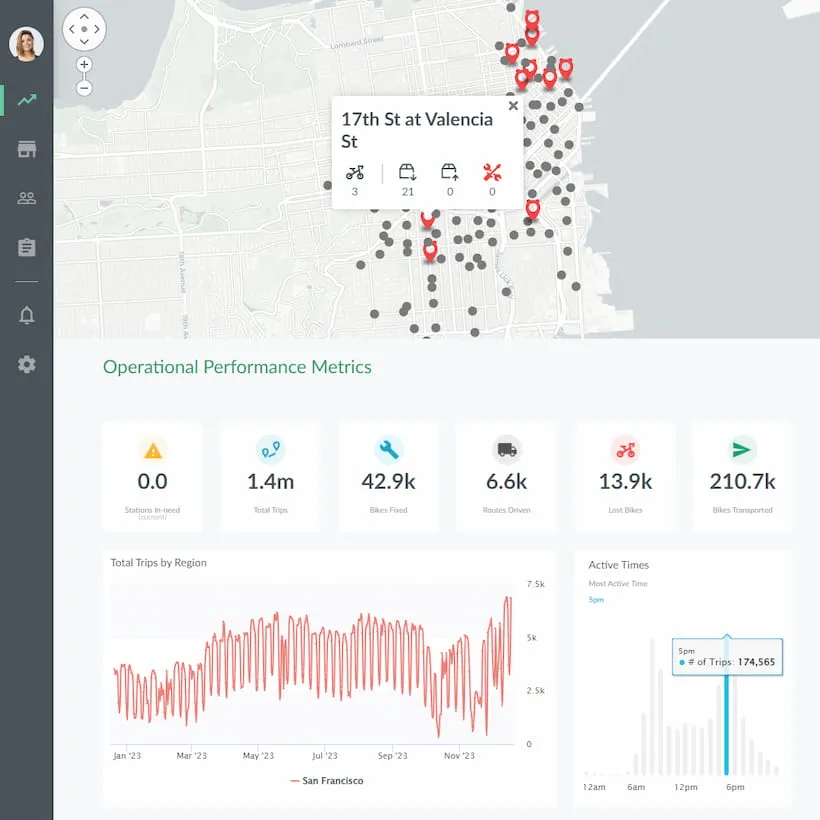
Interactive demo: Bikeshare Embedded BI, supported by Jaspersoft
Experience how to turn data into valuable insights that you and your customers can use to make better decisions.
