From quick wins to fully custom UX: A smarter way to engineer embedded analytics with Jaspersoft
For software engineers, embedding analytics is a tactical decision: how to achieve the best balance between speed of deployment and control over the user experience (UX). Jaspersoft, a highly customizable reporting and embedded analytics platform, offers a spectrum of integration options to meet these needs—from quick wins via iframe to fully customized, native experiences using the Visualize.js API.
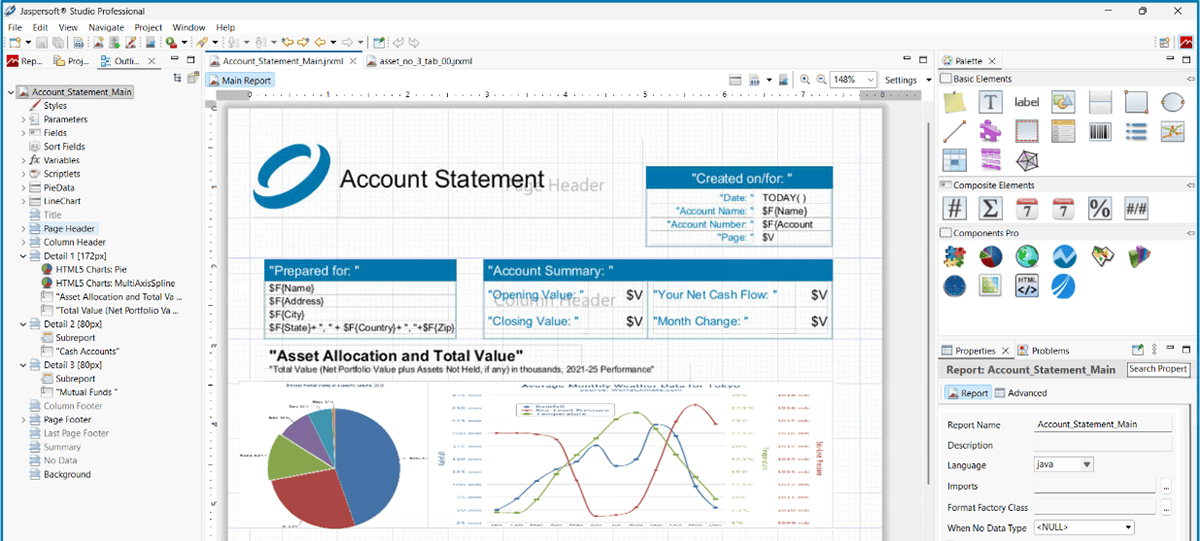
The foundation: Flexible report design
The true engineering power of Jaspersoft begins in the report design phase. Developers utilize tools like Jaspersoft Studio to create "pixel-perfect" report templates defined by a JRXML file. A critical architectural feature for embedding is parameterization, which allows a single report template to be dynamically controlled by the host application, enabling hundreds of variations. Content logic, such as controlling which visualizations or tables are displayed, can be added using a printWhenExpression tied to these input parameters. Once compiled, the resource is stored in the JasperReports Server repository, ready for embedding via APIs.
Core embeddable components
Engineers can embed resources stored within the centralized JasperReports Server repository, including:
Pixel-perfect reports: Jaspersoft acts as an execution engine, generating highly formatted standard reports that can include multiple tables, charts, QR codes, and barcodes.
Dashboards: Both individual reports and complete dashboards built on the server can be embedded directly into the custom application.
Flexibility and interactivity
Jaspersoft report templates are inherently flexible, supporting key interactive features that enhance the end-user experience:
Dynamic content control: Logic added via a printWhenExpression and input parameters allows end-users to dynamically include or exclude content like visualizations or tables from the final report output.
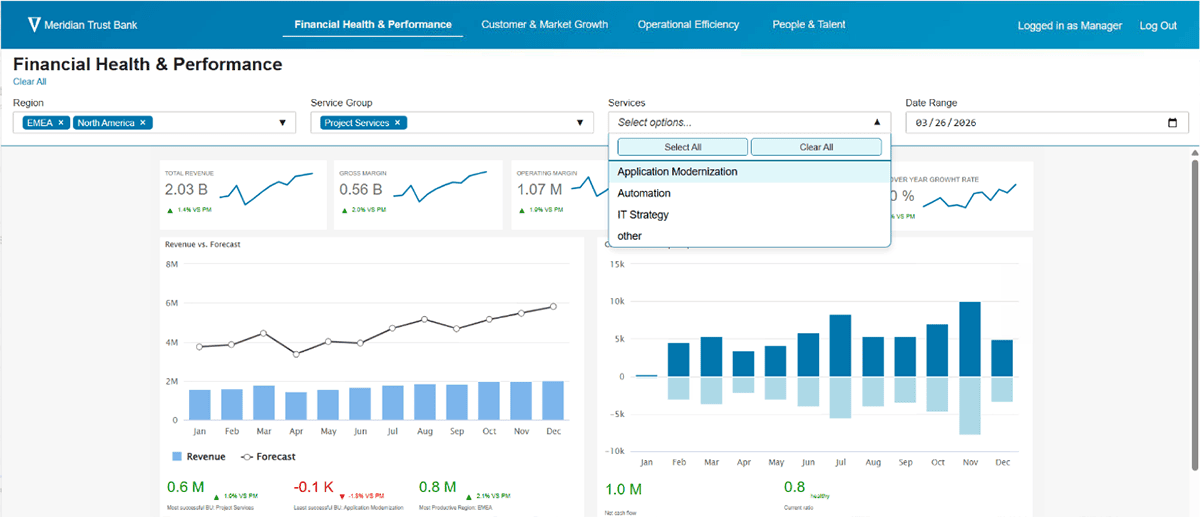
Chained filters (cascading controls): The system simplifies data filtering by supporting cascading input controls, where a selection in one filter (e.g., region) dynamically impacts the available options in subsequent filters (e.g., service group).
Element interactivity: Drill-down actions can be configured in the source report design and embedded into elements such as charts, tables, or images.
Engineering tradeoffs: Speed vs. control
The choice of embedding method dictates the tradeoff between time-to-market and control. See the differences side by side in this webinar.
Method |
Benefit |
Key features |
|---|---|---|
Iframe / basic embedding |
Speed (Low maintenance, quick win) |
Offers the richness of out-of-the-box features and fast time-to-market with lower maintenance. |
Visualize.js |
Total control (Native experience, customization) |
Enables a deep, programmatic integration with the host application. |
When using Visualize.js for deeper integration, developers gain maximum control over the embedded experience, allowing for:
Independent rendering: Separately render the report content and input controls (filters) in distinct containers within the host application.
Custom UI/UX: Create custom front-end components (e.g., custom-styled filters, specialized buttons) that perfectly match the application's style guide.
Application synergy & performance: Build custom workflows (e.g., an "Update Chart" button instead of immediate filtering) and optimize performance by fetching data only from specific filters.
Extensibility: Integrate third-party JavaScript charting libraries and use Java code for unique displays and interaction workflows.
A hybrid approach is often recommended: launching quickly with standard components to deliver an MVP, and then scaling up to custom development over time based on user feedback and evolving requirements.
To learn more about the architecture of Jaspersoft commercial edition, click here.

Related Resources
Beyond Dull Dashboards – Mastering Embedded Analytics
Watch how modern teams turn reporting into a product advantage with embedded analytics that are pixel-perfect, scalable, and easy to integrate. Our Jaspersoft experts demonstrate with real examples of report embedding, UI customization, and scalable reporting architecture for modern applications.
Join our live Jaspersoft demo with Q&A
See key features in action.
Get answers to the questions important to you.
Hosted by our Solutions Engineers.
DevEx with Jaspersoft: Where the developer calls the shots
Built by developers, for developers, Jaspersoft delivers the control and flexibility you need for powerful reporting and embedded analytics, helping you simplify your workflow with streamlined report development, data interoperability, server-side capabilities, and API access.