



SQL optimization techniques for faster reporting and embedded analytics
As data volumes grow, dashboard lag can creep in. Even a few seconds of delay to each action can chip away at a team's productivity. This is especially true for embedded analytics, where reports run within a live application rather than in a standalone Business Intelligence (BI) tool. Users expect the dashboard to be just as fast as the rest of the product.

Dashboards often run so slowly because the SQL database behind them has inefficient joins, unindexed columns, and queries that scan far more data than the report actually needs. SQL optimization addresses these bottlenecks directly by reducing the amount of work the database must perform before it can return results.
Teams can identify SQL bottlenecks using execution plans, refactor common reporting anti-patterns, leverage materialized views and pre-aggregation for dashboards, and optimize data retrieval with partitioning and sharding techniques. Learn how to integrate optimized queries with high-performance reporting tools like Jaspersoft.
Execution plan analysis and indexing strategies for large datasets
Execution plans are essential for identifying SQL bottlenecks and shaping effective indexing strategies for large datasets. By showing how the database engine retrieves and processes data through visual or text-based maps, they can help pinpoint performance issues, troubleshoot and report slowness, and fine-tune for better efficiency.
To identify bottlenecks for SQL performance tuning, look for the following in execution plans:
- High-cost operations: Look for operations consuming the most query cost. They are often the clearest starting point for diagnosis. An example of a high-cost operation is a full table scan. Also called a clustered index scan, this forces the engine to read every page on disk to find matching rows. Fix it by creating a non-clustered B-Tree index on the columns filtering the data. This will narrow the search from millions of rows to a few pages.
- Thick arrows: In graphical plans, wider lines mean large volumes of moving data.
- Large differences between estimated and actual row counts: This can indicate outdated database statistics.
- Exclamation marks: These can indicate implicit data conversions or tempdb spills.
Refactoring complex queries to reduce report latency
Beyond indexing, the structure of a query can significantly affect how quickly a report loads. Some common patterns tend to crop up again and again in slow reporting queries, and each has a straightforward fix.
Watch for the following in your own queries:
- SELECT*: Fetching every column in a table, even when you only need a few, wastes memory and bandwidth for no real benefit. The fix is simple: only name the exact columns you need.
- JOIN optimization: Joining too many tables at once, filtering on unindexed columns, or accidentally using CROSS JOIN can also increase latency. To address this problem, only join needed tables, add indexes to join keys, and place filters in the WHERE clause or ON clause correctly.
- Overly complex or deeply nested subqueries: Deeply nested, multi-layer subqueries can be tough to read and tricky for the database planner to optimize, which can slow things down. Instead, try using Common Table Expressions (CTEs) with the WITH clause to break logic into clear steps. Subqueries are best kept for quick, simple single-value lookups. Either way, you’ll improve both readability and execution plans. In general, go for CTEs when you want cleaner code, reusability, or need recursive logic.
Leveraging materialized views and pre-aggregation for dashboards
Not every report needs to reflect the current second. Heavy calculations that run fresh on every page load can slow an app down for no real benefit.
Fortunately, you can solve this by pre-computing the heavy work ahead of time through:
- Summary tables: For aggregations that are especially heavy or that combine data from several large tables, a dedicated summary table can be built and updated on its own schedule, often overnight or at set intervals. The dashboard can query this smaller, pre-aggregated table directly rather than accessing the full dataset.
- Materialized views: Unlike a standard view, which re-runs its underlying query every time it's accessed, a materialized view stores the actual result set on disk. The database refreshes it on a schedule rather than recalculating it on every request. Note that the right refresh interval depends on how current the data needs to be.
Optimizing data retrieval with partitioning and sharding techniques
Large tables mean more data a query may need to scan or process, which can increase the time it takes to find relevant data.
Horizontal and vertical data organization address this from different angles. Horizontal techniques reduce how many rows a query has to touch, while vertical techniques minimize how many columns it has to read. Together, they reduce irrelevant disk reads and keep scan times manageable as tables grow.
Horizontal techniques include horizontal partitioning, which splits a large table into smaller pieces based on rows, typically within the same database system. This is especially useful for time-series reporting because queries can potentially scan only the partitions that contain relevant time periods. Partitioning can also simplify data lifecycle management. For example, old time-based partitions can be dropped or detached efficiently rather than deleting large numbers of rows individually.
Horizontal techniques also include sharding, which distributes subsets of data across separate database nodes or servers. This can scale out storage and processing capacity across multiple machines. Sharding can be effective for multi-tenant reporting since it uses the tenant ID as the shard key. This setup can help isolate workloads between tenants and reduce the risk that one tenant's heavy workload overwhelms resources needed by others.
Vertical techniques include vertical partitioning, which divides a large table into smaller parts based on columns, usually within the same database instance.
Integrating optimized queries with high-performance reporting tools
These techniques can help reduce latency, but only if the reporting layer on top of the database can make the most of them.
That’s where Jaspersoft comes in. As a reporting tool designed to run queries efficiently, it displays results without adding unnecessary overhead. Its architecture is built to work with well-tuned data sources, supporting everything from pixel-perfect scheduled reports to configuring ad hoc cache for embedded use cases, without slowing down the work already done at the database level.
Learn more about how Jaspersoft works today.
Ready to give it a spin?
Start your 30-day trial now.

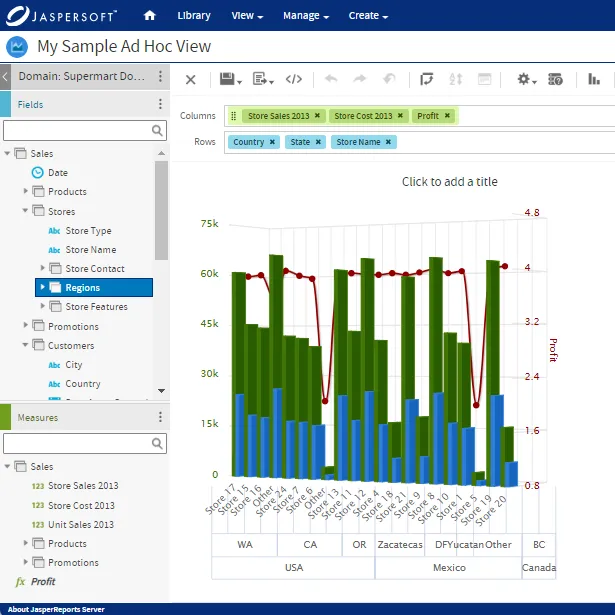
Try Jaspersoft - Free Trial
Efficiently design, embed, and distribute reports and dashboards at scale with Jaspersoft.
Build versus Buy: An In-depth Guide
This whitepaper provides a framework for the decision-making process and critical trade-offs between building or buying an embedded BI and reporting tool.
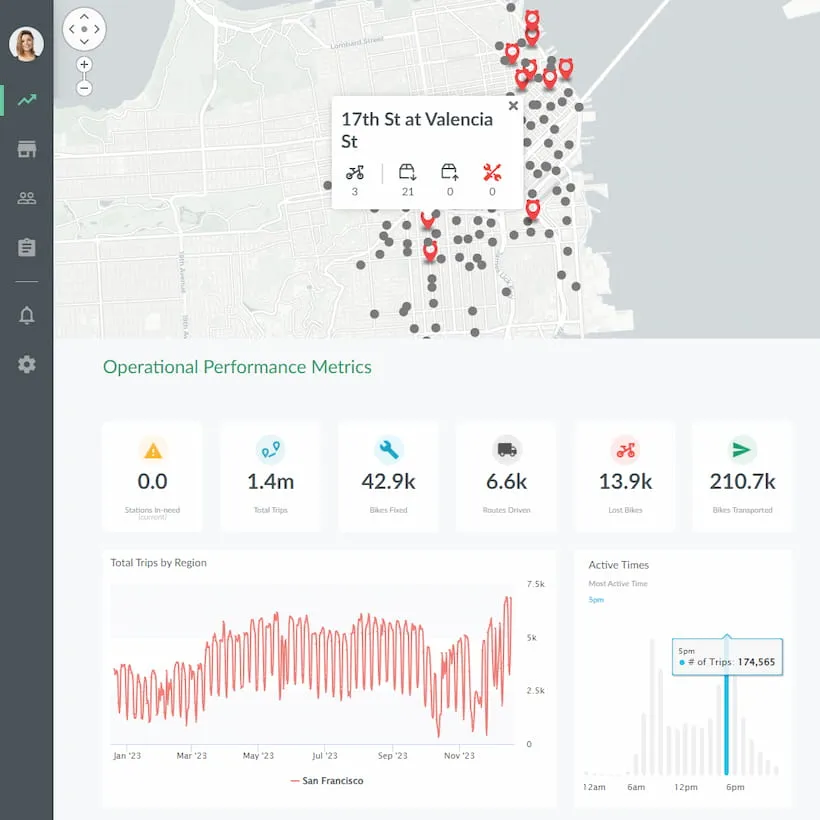
Interactive demo: Bikeshare Embedded BI, supported by Jaspersoft
Experience how to turn data into valuable insights that you and your customers can use to make better decisions.
