


What's new in Jaspersoft
The latest advancements to help you make better decisions faster

Note: some versions below have been designated as Long Term Support (LTS). See here for more details.
Jaspersoft 10.1.0 (07/2026)
This release is a Mainstream Release available to customers, and includes:
- New and exciting features to Jaspersoft®. View the Release Notes.
- Advanced password validation and industry-standard one-way hashing to prevent credential recycling and protect against evolving threats.
- Re-engineered JasperReports® Server core to eliminate architectural bottlenecks while maintaining complete UI consistency.
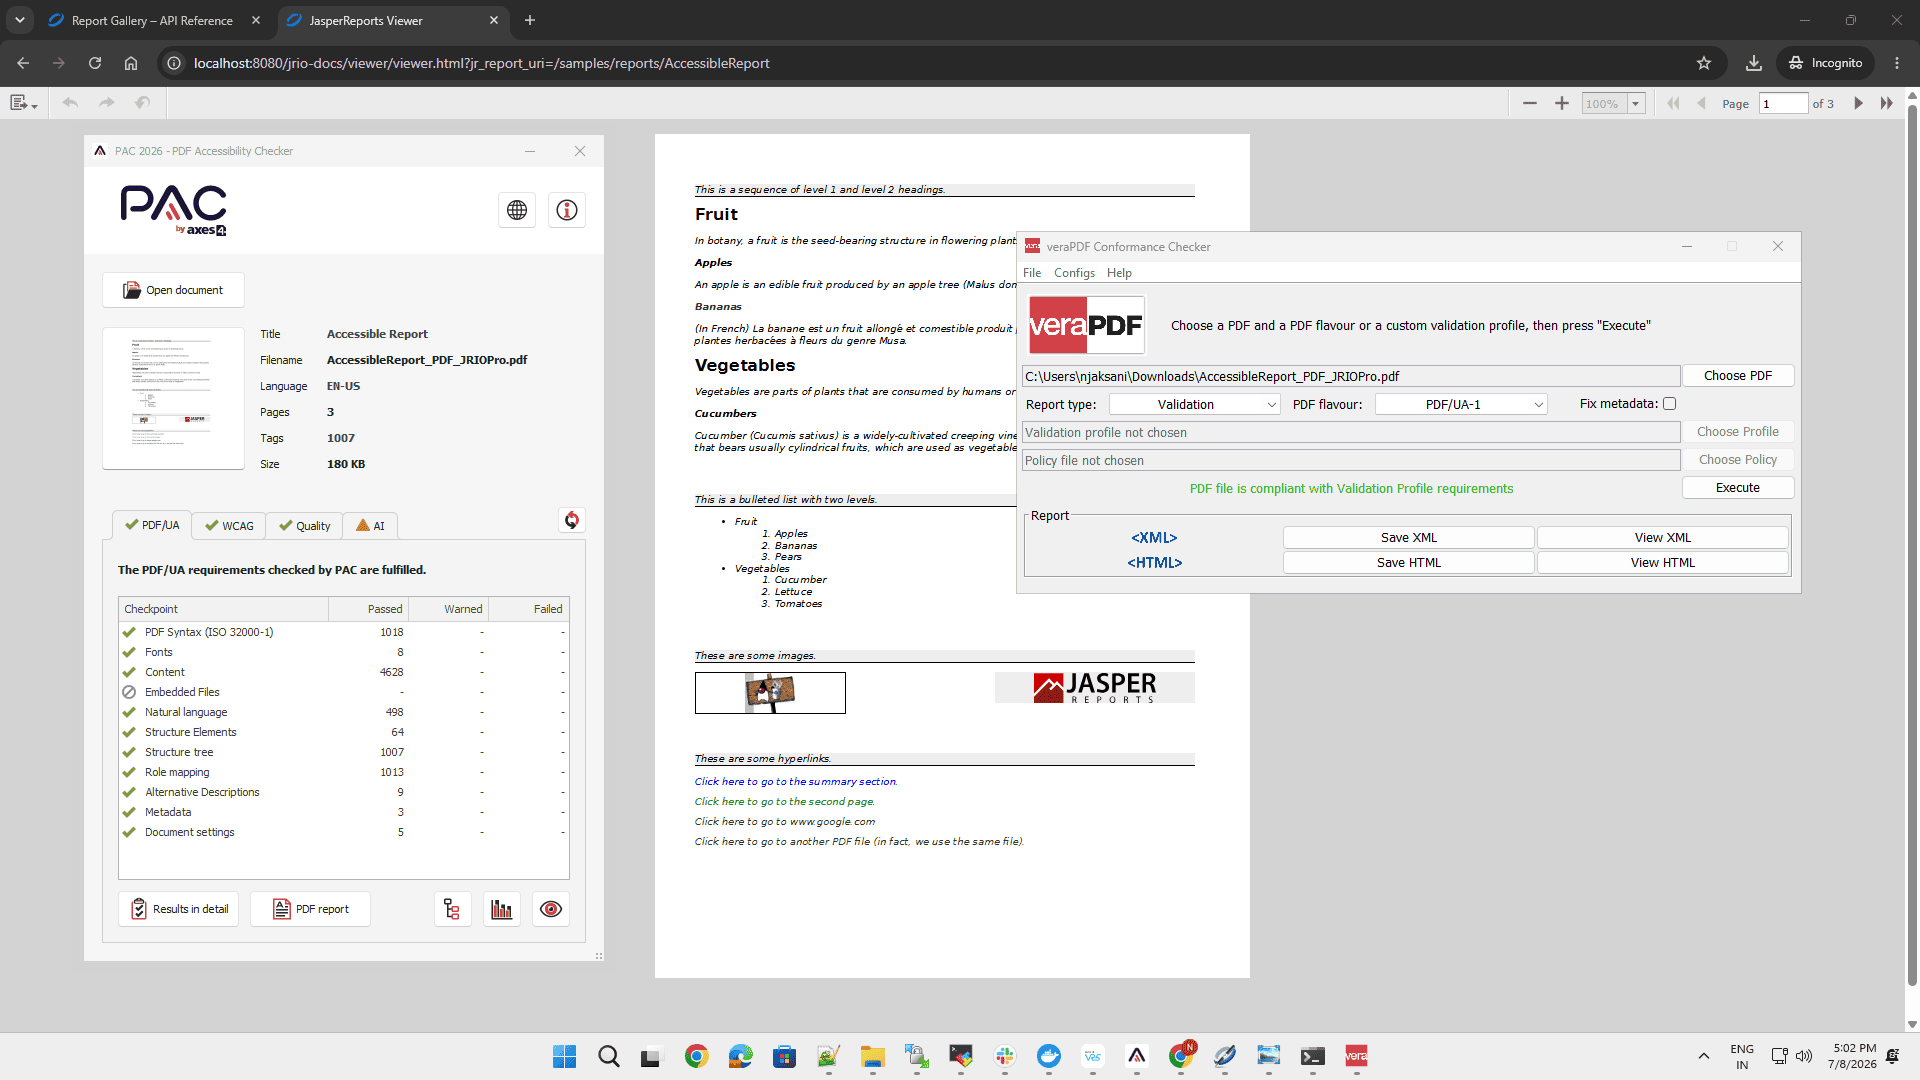
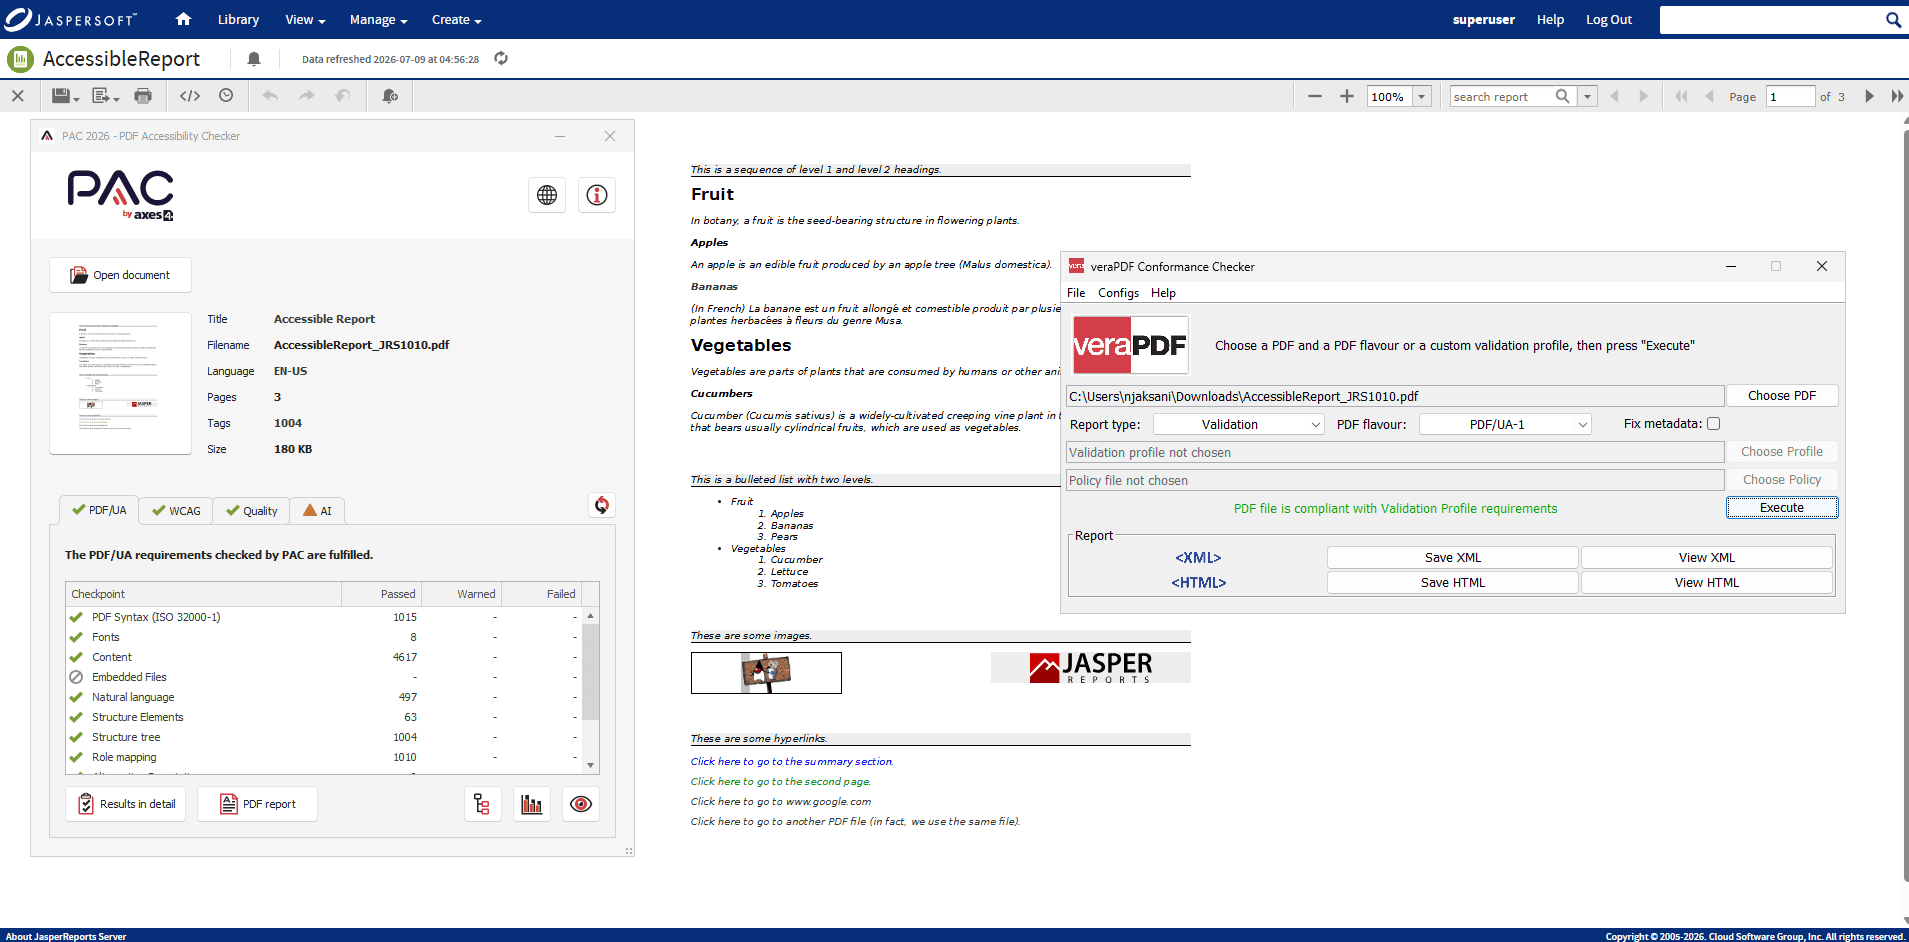
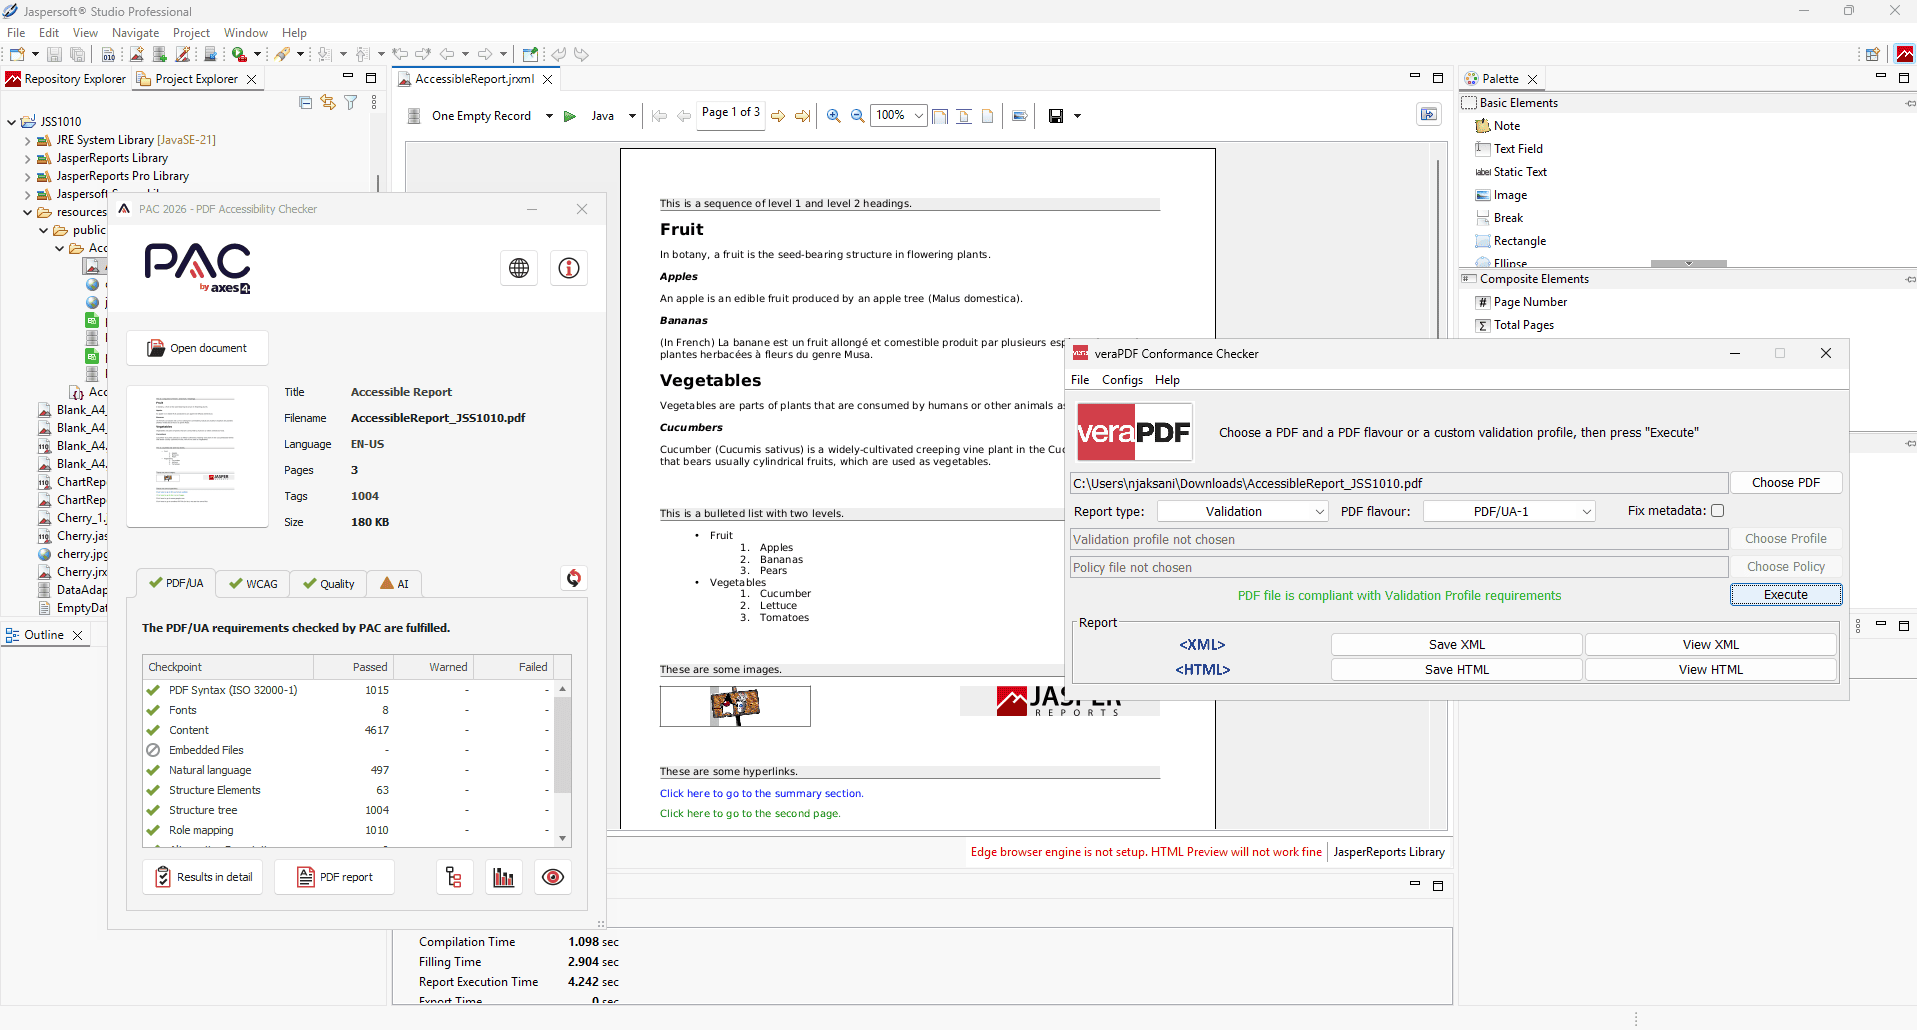
- JasperReports Library bridges high-fidelity design with digital inclusivity. Offering WCAG 2.1 and PDF/UA compliant outputs, we help regulated sectors meet legal standards without compromising visual quality. Our "pixel-perfect" reports now automatically include essential metadata for seamless screen reader compatibility.
Jaspersoft 10.0.0 (11/2025)
This release is the latest LTS Release available to customers, and includes:
Watch the Jaspersoft 10.0 release webinar (54:31) for an in-depth look at the next generation of embedded analytics and reporting.
- New and exciting features to Jaspersoft. View the Release Notes .
- Upgrade to Jakarta ensuring seamless compatibility with evolving technologies.
Jaspersoft 9.0.1 (09/2024)
JasperReports® Server for AWS Marketplace
Amazon Machine Image (AMI) changes in JasperReports for AWS 9.0.1 include:
- Updated base AMI from Amazon Linux 2 to Amazon Linux 2023.
- Updated PostgreSQL version from v14 to v15.
- Chromium is not installed with deployment. Instead, the user may choose to install Chrome manually.
Marketplace CloudFormation Template (CFT) changes in JasperReports for AWS 9.0.1 include:
- Support for public and private subnets for EC2 instances.
- Replaced Chromium with Chrome. The users must provide consent to install chrome. For details, see the Chrome AWS section in Jaspersoft for Amazon Web Services (AWS) User Guide v9.0.1 .
Jaspersoft 9.0 (01/2024)
In this webinar, our product and engineering team provide an in-depth look at the exciting enhancements in this release:
Jaspersoft: What's New in 9.0 (1:31:29)
Jaspersoft 9.0 / JasperReports IO 4.0
This release is the latest LTS Release available to customers, and includes:
- Adds new and exciting features to Jaspersoft and JasperReports IO. View the Release Notes.
- Removes Progress JDBC Drivers from the Jaspersoft Product Suite. View details and FAQs here.
UI improvements
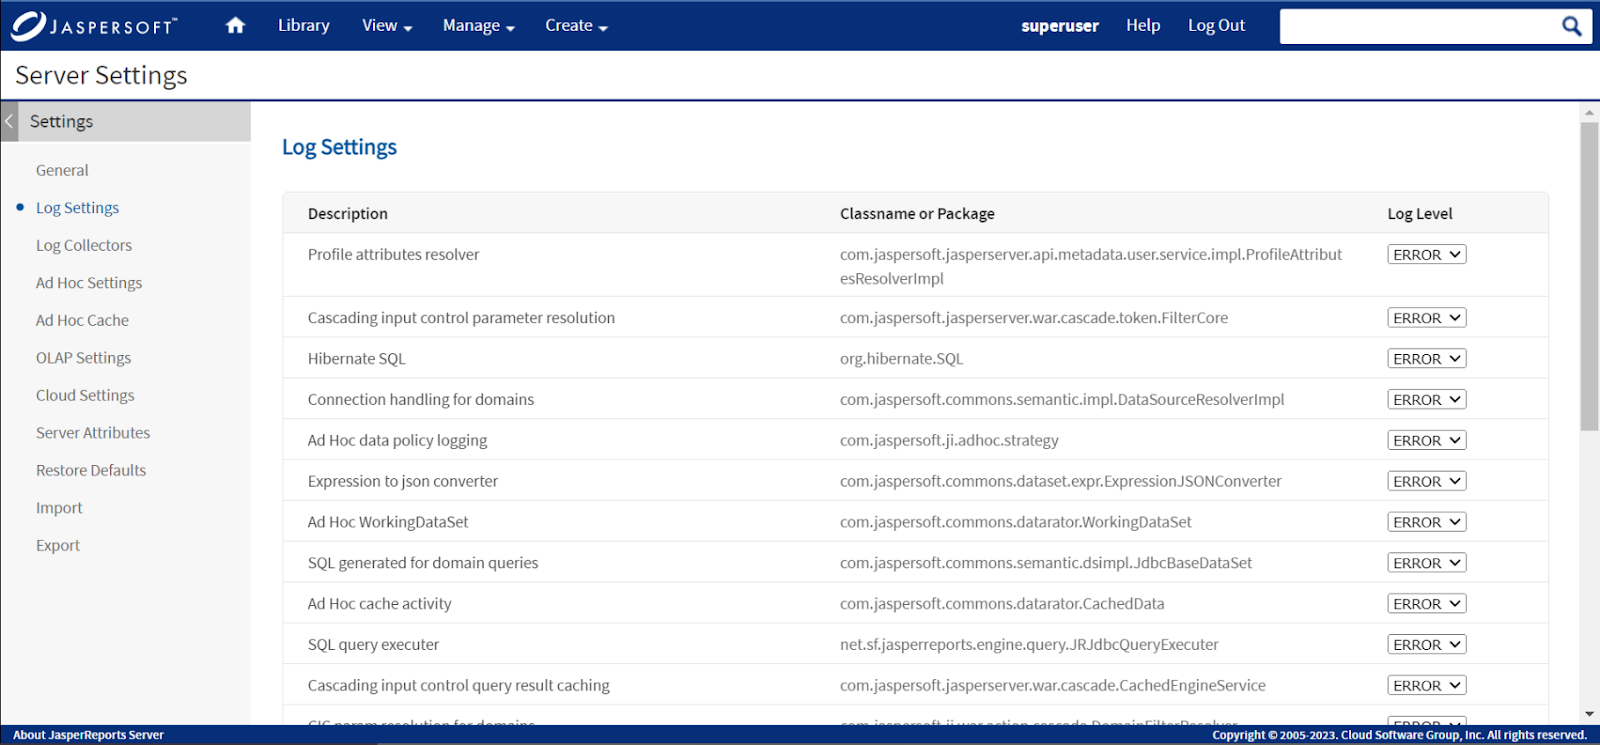
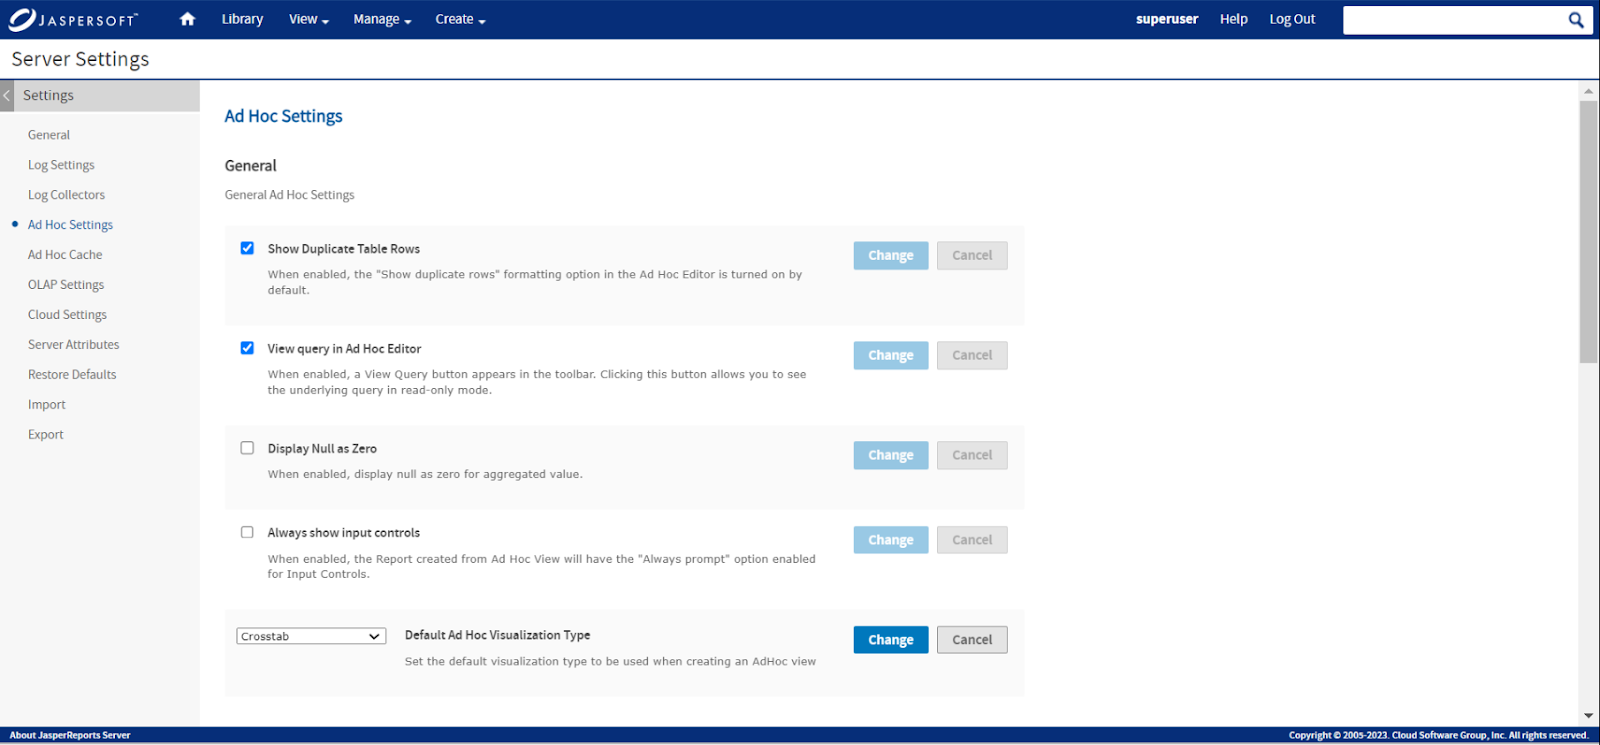
The Server Settings page has a new look and feel. It has an improved look and provides ease of use.
The new Ad Hoc Settings provide administrators the ability to set default Ad Hoc properties at the server-level.
- The administrator can decide if the Input Controls panel or window is always shown while opening an Ad Hoc view.
- The default Ad Hoc visualization type can be set to Table, Crosstab, or any of the available charts.
Drill Down
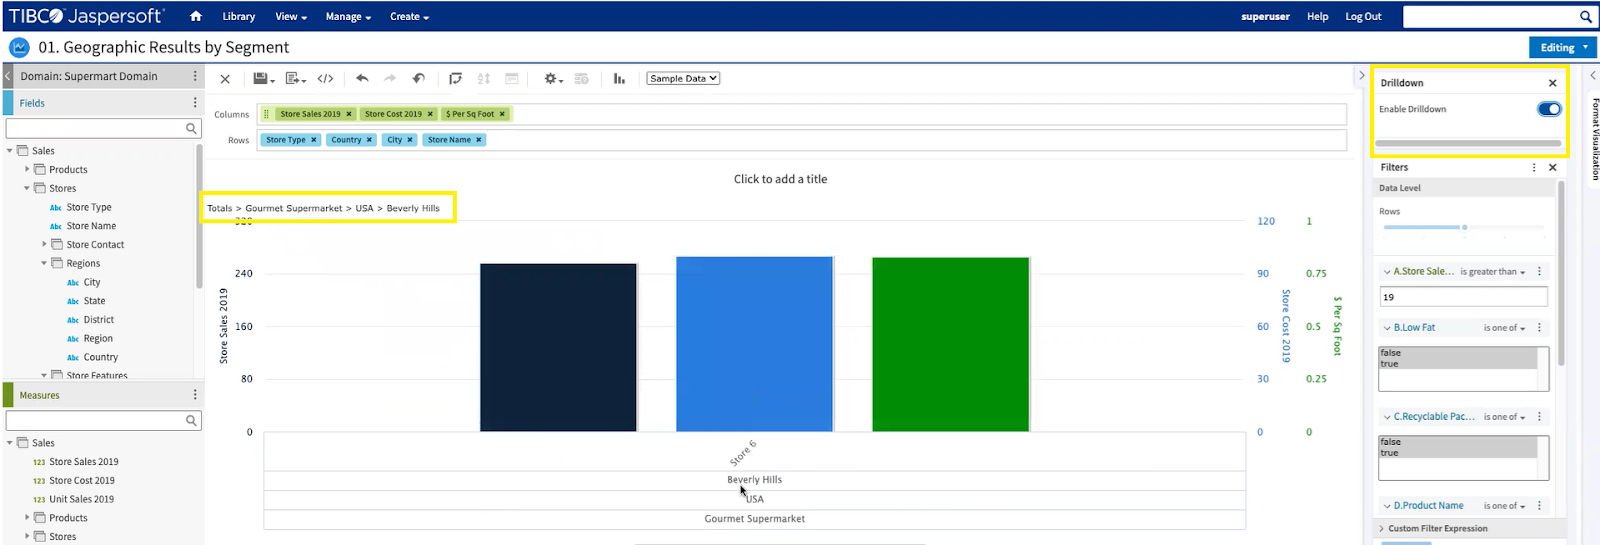
In the Ad Hoc Designer, there is a new “Drill Down” switch for better interactivity. Once enabled, you can drill down to move from a higher level of data to a granular level. You can click on a data point in a chart that contains hierarchical data, to view detailed data. You can follow the breadcrumbs to drill up again to see the higher levels of data.
An Ad Hoc View with Drill Down enabled can be added to a dashboard for better dashboard interactivity.
Report Hyperlinks in Dashboards
Reports created in JasperReports Studio now offer support for a new Hyperlink type called "dashlet". This feature enhances interactivity by allowing integration with other dashlets within JasperReports Server Dashboards. You can dynamically link hyperlink values as parameters to interact with and change the view of other dashlets.
Trino integration
JasperReports Server now offers the capability to utilize Trino as a data source for reports and analysis, integrating with the open-source distributed SQL query engine designed for high-performance querying and analysis across different data sources in various formats and locations.
OAuth
JasperReports Server now provides out-of-the-box support for integration with OAuth OpenID providers, serving as both the user authentication mechanism and the source for user metadata. Configuration has been simplified for OAuth providers that implement OAuth IDP.
Observability
- Improvements to logging
Now, Jasper Server logs follow a new log message pattern to ensure coherency and standard placements of the log items. This makes the integration with third party software tools for log analysis easier. - Better monitoring
Administrators now have more insights into JasperReports Server. Administrators can generate a file with a snapshot of Jasper Reports server hardware and other diagnostic jmx metrics like active users. - Traceability in the Scheduler
For better visibility, administrators can now see traces for scheduled report jobs by connecting to Open Telemetry.
Security improvements
- Updates to JNDI data source
JNDI security now enables access control to data sources. The new version includes two new JNDI data sources, namely jasperserverSystemAnalytics, and jasperserverAuditAnalytics, both configured with read-only access.
Administrators can enable access control to the jasperserver JNDIs by changing the metadata.hibernate.jndi.restrictedAccess.enabled property in hibernate properties. - Library upgrades
For better security, some of the Internal Libraries are upgraded to avoid Critical and High CVEs.
Jaspersoft Studio 9.0 and JasperReports Library 9.0
- Hyperlink interactivity for Jaspersoft Studio reports in dashboard
Reports created in JasperReports Studio now offer support for a new Hyperlink type called "dashlet". This feature enhances interactivity by allowing integration with other dashlets within JasperReports Server Dashboards. You can dynamically link hyperlink values as parameters to interact with and change the view of other dashlets. - Watch video (5:10)
- Added new Ad Hoc component for JasperReports Server
Created JRL custom component for Ad Hoc views so that changes made in the Ad Hoc view is reflected in Ad Hoc report - Fixed Google Map component behavior
- Added support for API KEY for preview / pickup dialogs
- Added a custom option to be added (as usual to the Jaspersoft Studio (Professional).ini file) in order to disable the Google Map interactive usage. The flag can be added like this:
-Dcom.jaspersoft.studio.widgets.googlemap.disabled=true
- RCP version is now based on Eclipse 4.29 platform
- Updated the bundled JRE to Adoptium Temurin OpenJDK 17.0.8.1+1 (ex Adopt OpenJDK)
- Added FastExcel-Reader library (version 0.15.6) to support the new Excel datasource implementation
- Added support for PDF/A-2a, PDF/A-2b, PDF/A-2u, PDF/A-3a, PDF/A-3b, PDF/A-3u
- Added JRPptxExporter to support report PPT document using tables as its content
- Added support for WEBP images
- Removed Xalan library dependency
- Removed all TIBCO Progress JDBC drivers
- Removed outdated SQLite JDBC driver
JasperReports Server 9.0
Alerting
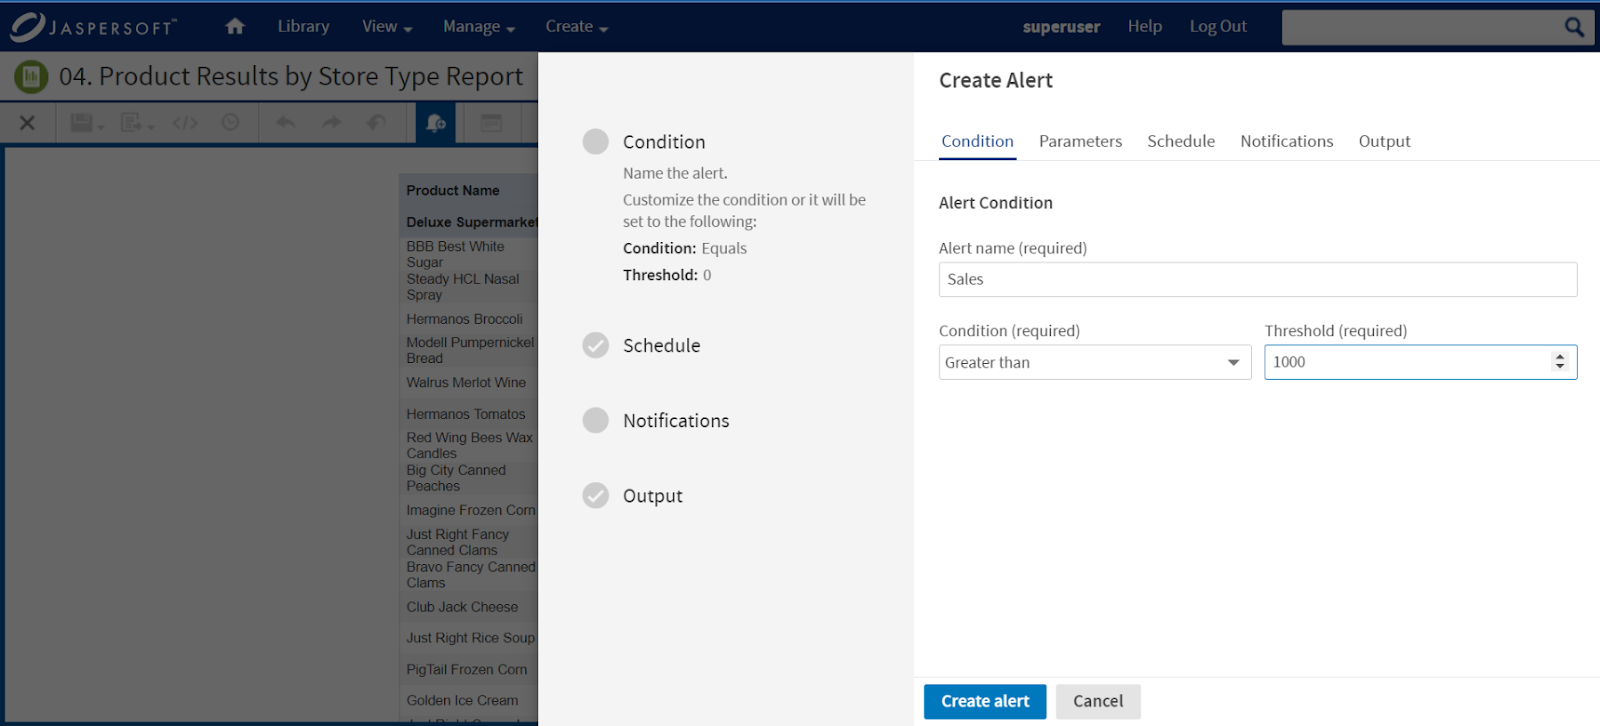
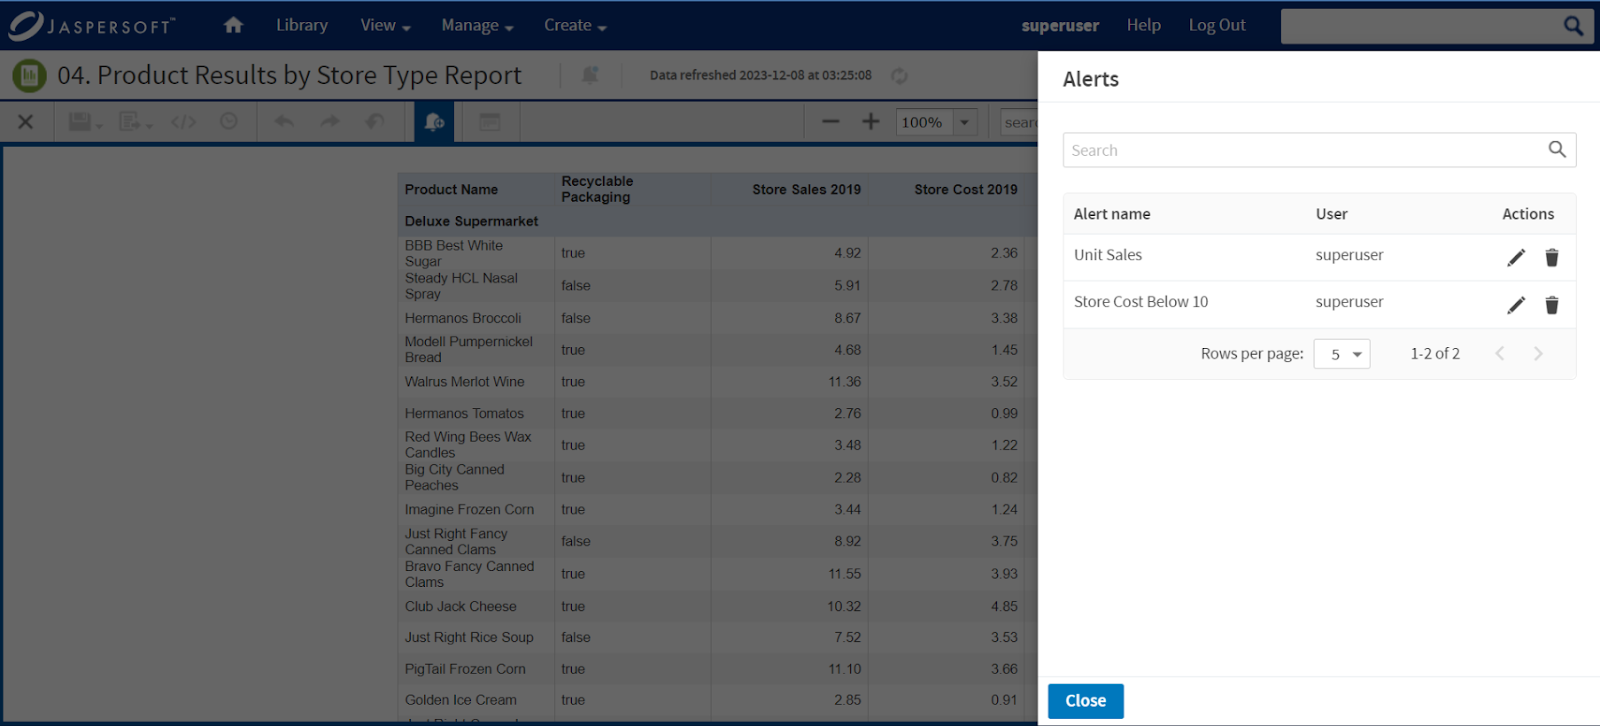
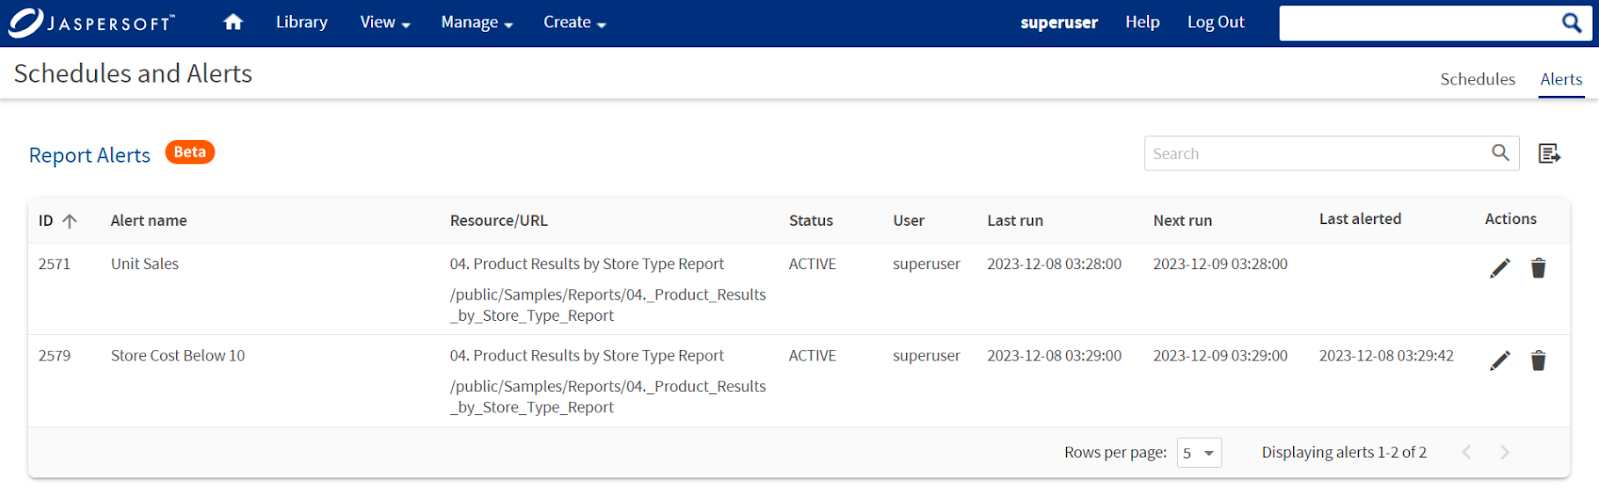
With the new Alerting feature in the JasperReports Server Report Viewer toolbar for Tables and Crosstabs, you can set up alerts to monitor your data. This functionality allows you to receive notifications whenever there is a change in the data. The alerting feature can be configured based on specified thresholds, data points, and conditions during the alert setup process. You receive email notifications for the triggered alert after getting the specified condition matching the threshold value.
You can conveniently access and manage their alerts on the Schedules and Alerts page.
Advanced Date Time Calculation
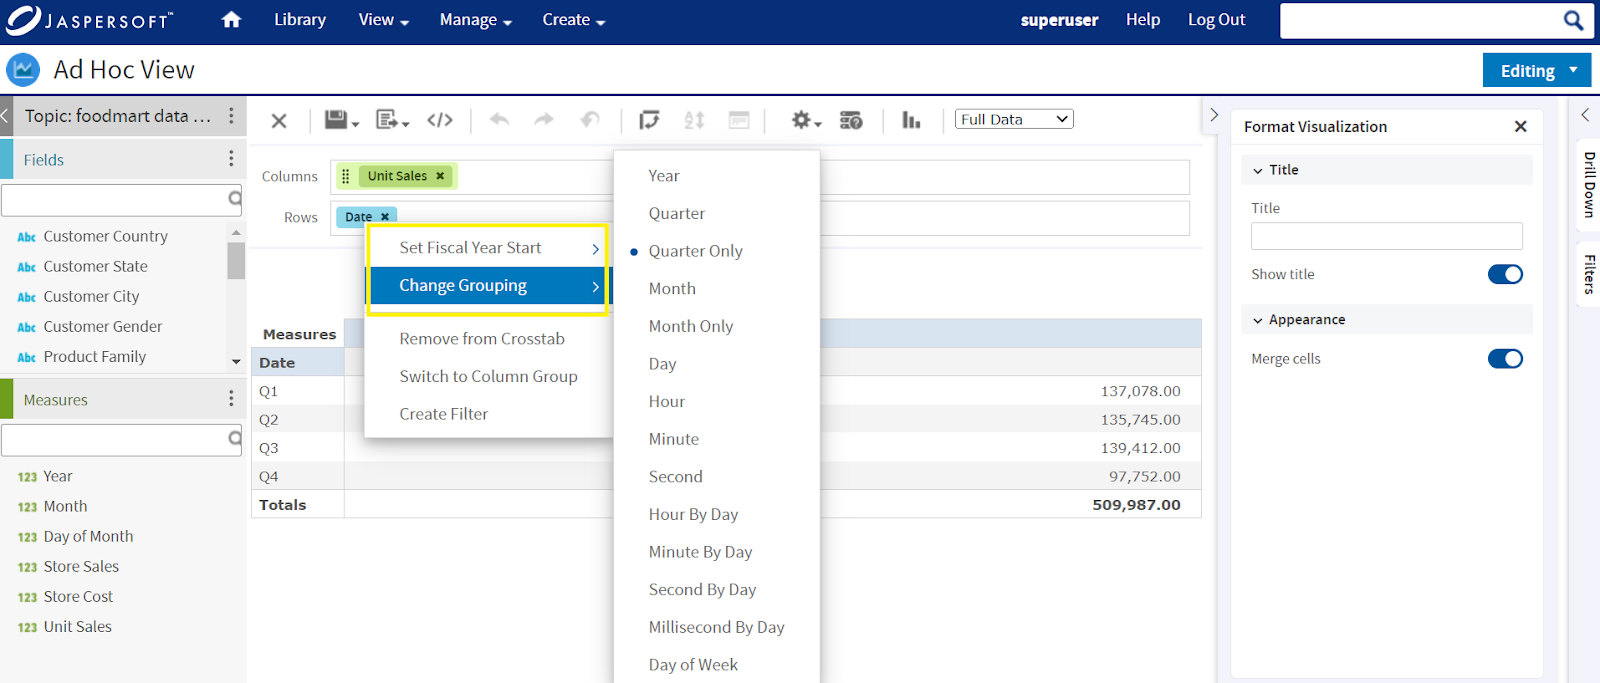
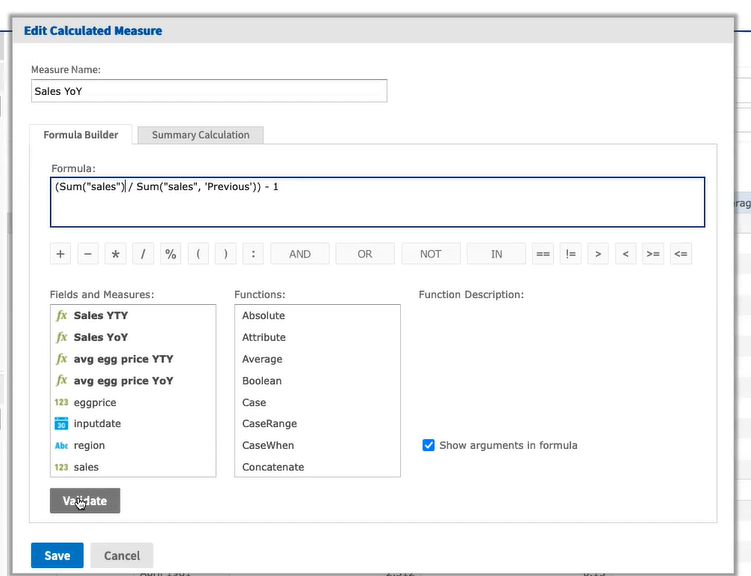
New Date Time functions have been introduced for Ad Hoc calculated fields, enabling you to perform calculations such as "Year to Date," "Period to Period," and "Period over Period."
To support these calculations, the old Date Grouping functions "Quarter and Month" were renamed to "Quarter and Year" and "Month and Year" respectively, as well new Quarter and Month were introduced which group only by Quarter or only by Month.
You also have the flexibility to set the Fiscal Year start, providing control over the calculation start point.
Sending email using Microsoft 365
In the latest version of JasperReports Server, you now can configure the scheduler to utilize Microsoft Graph API authentication for sending emails through Microsoft 365.
New Platform and Database Updates
- Added support for MacOS 13.x
- Added support for RHEL 9
For the complete list of new and updated Connectors and Platforms, please refer to the documentation on the Jaspersoft Community site.
Cloud Updates
- Docker version updated (Certified Docker engine 24.0)
- Kubernetes version updated
- Bug fixes and readmes updated in js-docker
- Added support for JNDI security (read-only access) configuration in K8s/jrs/helm/values.yaml
For the complete list of items in the Jaspersoft 9.0 release, you can refer to the Release Notes.
JasperReports® Web Studio 3.0
A more feature-rich version
JasperReports Web Studio 3.0 is a powerful version of JasperReports Web Studio - Professional Edition 2.0 and 1.0
Drag and drop field
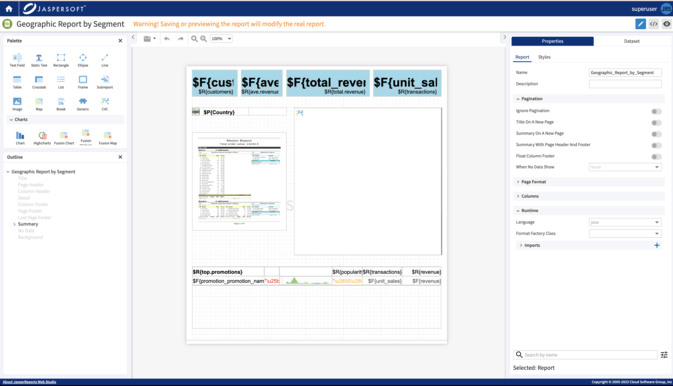
Report creation gets simpler with the drag and drop field feature. You can now drag fields from the dataset view and drop them into the report design. A TextField is created automatically with the corresponding expression.
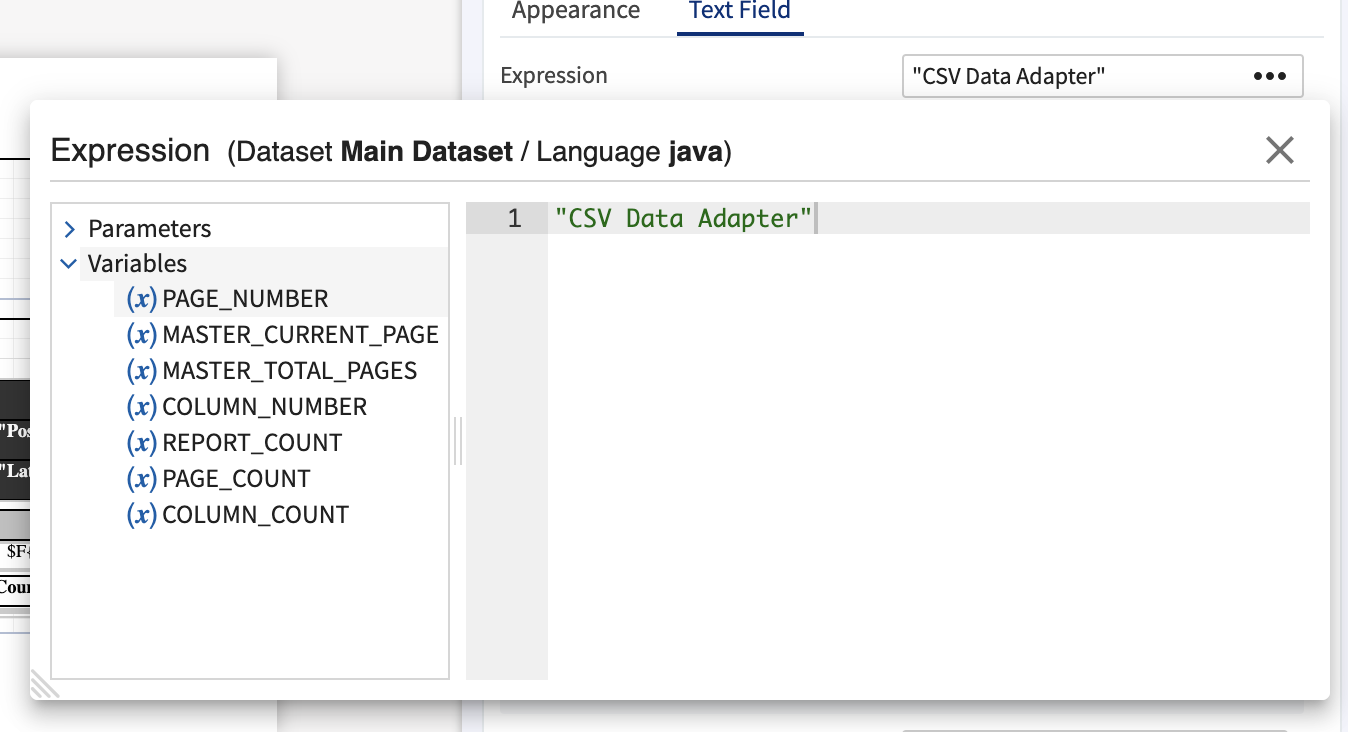
Expression Editor
The expression editor allows you to edit an expression. It includes two panels, one showing all the dataset objects that can be used in the expression and the second showing the expression itself.
Validation and refactoring of the dataset model
Automatic validation of the model allows you to view errors in the report. If you change any dataset object, all the references will be automatically updated in the Report Template.
Built-in parameters prompts
Parameters prompt the user to setup report parameters. Support was added for built-in parameters (local time zone, ignore pagination, max rows).
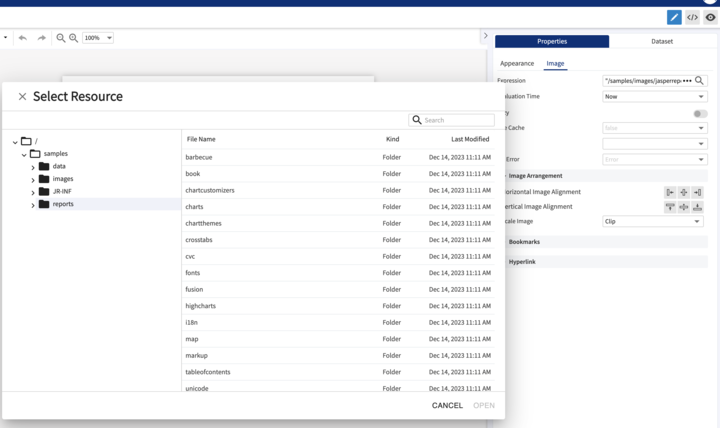
Image and sub report selection
You can now browse and select elements from the repository when selecting the target resource for an image, subreport or style template. The path is:
- relative to the current directory, if the target resource is in current directory or subdirectories
- relative to the root of the repository in all other cases
Files and Folders
- Select file resources
A dialog box to help you find files is introduced. This is helpful for properties that point to a file in the repository. - Upload folders
You can upload files or folders into any repository. - Download files and folders
You can compress the files or folders and download them as zipped files.
Copy and paste in the designer
With the improved report layout designer, you can now copy and paste elements in it. You can use the standard shortcut keys or the context menu option.
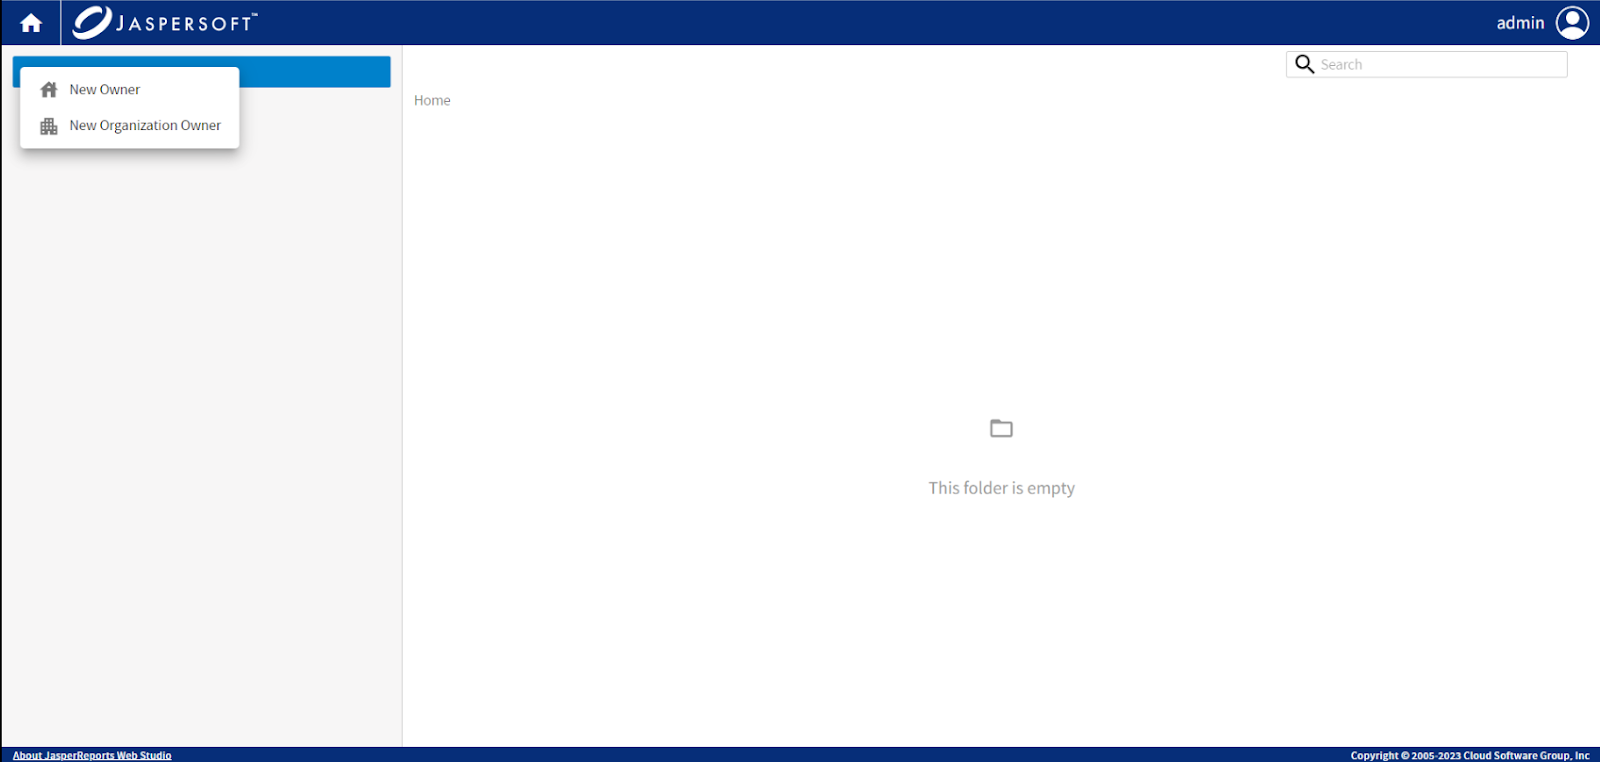
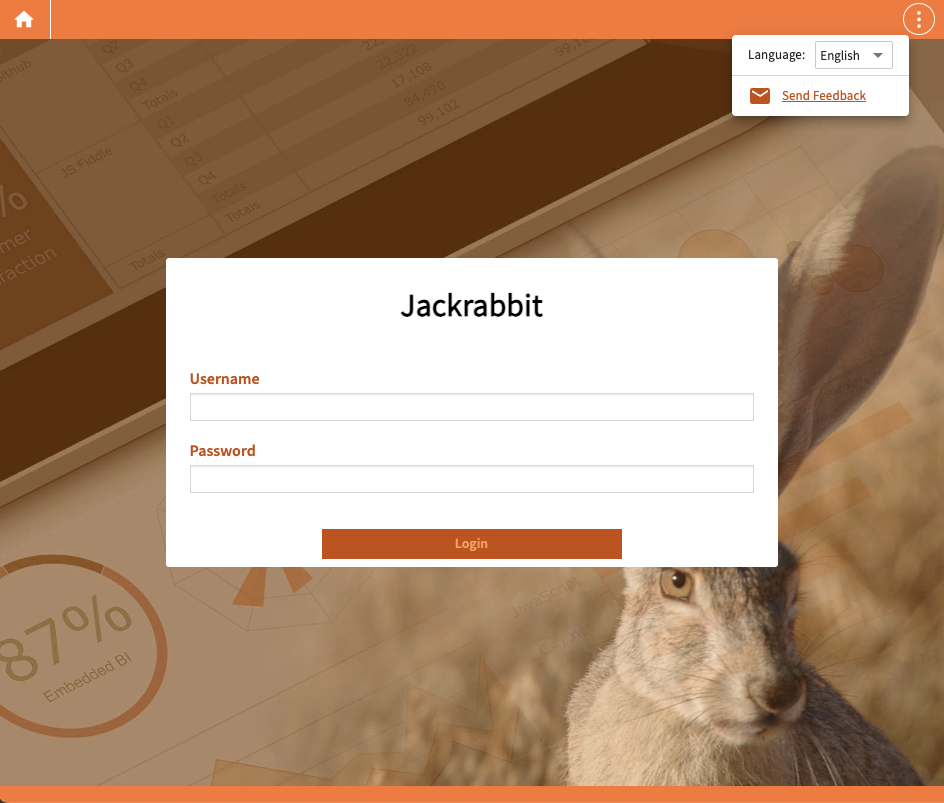
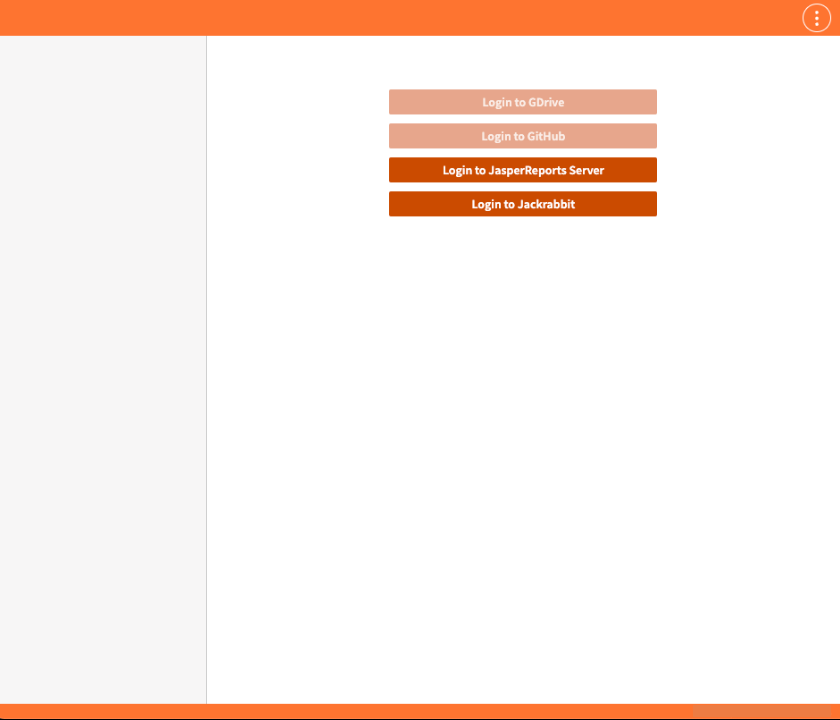
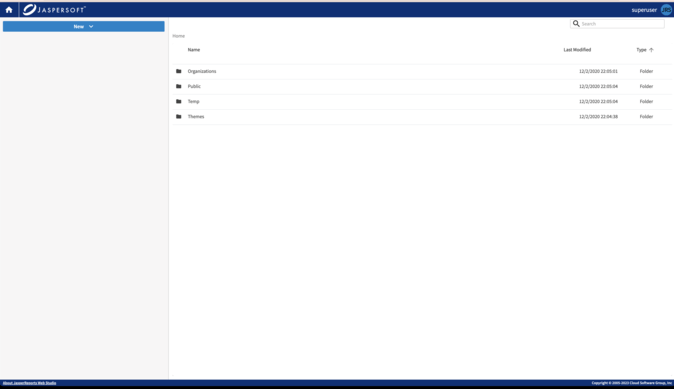
JackRabbit Repository
JasperReports Web Studio 3.0.0 offers the capability to utilize JackRabbit as a repository.
Report unit
When generating the Report Unit, you have the option to choose Use a blank JRXML. Selecting this option results in the creation of a report unit containing a blank report template (JRXML). After submitting, this JRXML is automatically opened in the integrated JasperReports Web Studio. In this environment, you can seamlessly create or modify pixel-perfect reports with ease.
White labeling
By providing a custom css stylesheet it is possible to customize the look and feel of any page in JRWS. This includes colors, background pictures and elements in each page. The branding options include the ability to specify custom content for the about dialog. The logo can be changed by using the custom CSS.
Docker Image
You can run the standalone JasperReports® Web Studio 3.0 from Docker.
Jaspersoft 8.2 (06/2023)
Jaspersoft 8.2 / JasperReports IO 3.2
View our What's New in 8.2' Webinar (1:26:56) with our team of experts covering the latest in 8.2, followed by a live Q&A.
Jaspersoft 8.2 / JasperReports IO 3.2 is the latest Mainstream Release available to customers.
- This release adds new and exciting features to Jaspersoft and JasperReports IO. View the Release Notes.
- Removes insightsoftware Simba JDBC Drivers (“Simba Drivers”) in the Jaspersoft Product Suite. You can view details and FAQs here.
JasperReports Web Studio 2.0
Much improved and production-ready
- JasperReports® Web Studio 2.0 is a much improved and more functional version of JasperReports®Web Studio - Professional Edition 1.0.
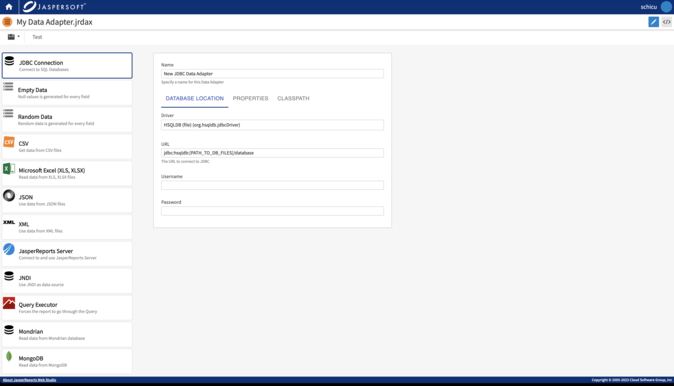
- Data Adapters are now fully supported (jdbc, csv, excel, json, xml, JRS, jndi, query executor, mondrian, mongodb, datasource provider, datasource, javaBean, ejbql, spring, hibernate, xmla).
- All JasperReports Library Elements, Highcharts, Fusion, Maps, Barcodes, and CVC are fully supported.
- More advanced Dataset and Query Editor with Query Preview, Tables Schema browsing, and Fields generator are now available.
- Report Viewer with Parameter Prompts, Bookmarks, Preview, and Search are now fully supported.
- Enhanced Properties view and elements rendering are now available.
Report Splitting
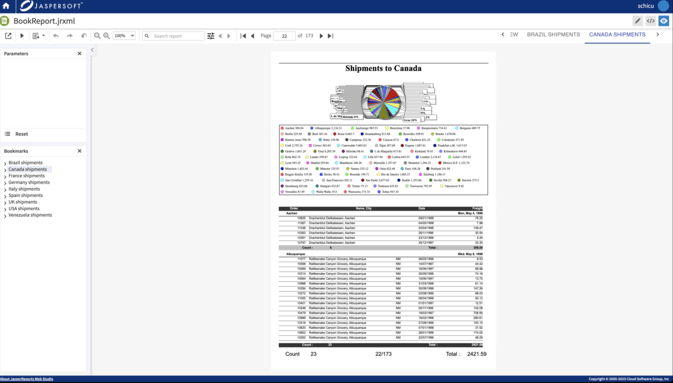
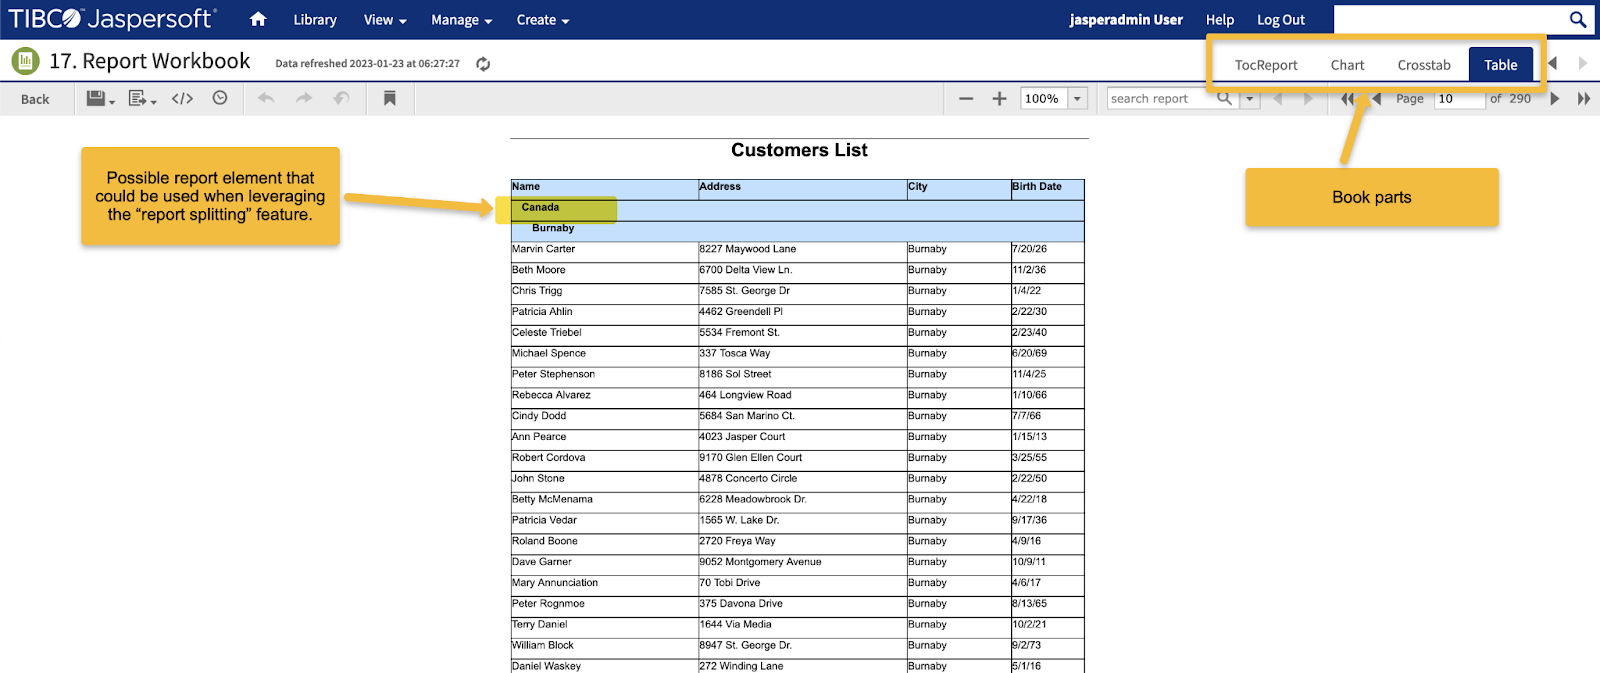
- Report splitting is a quicker, easier alternative to report bursting.
- Report bursting works by having a report that creates scheduled jobs in a JasperReports Server instance for other reports. This way running a report results in having several other report jobs and outputs created based on the initial "burster" report execution on the initial "burster" report execution. Read more here.
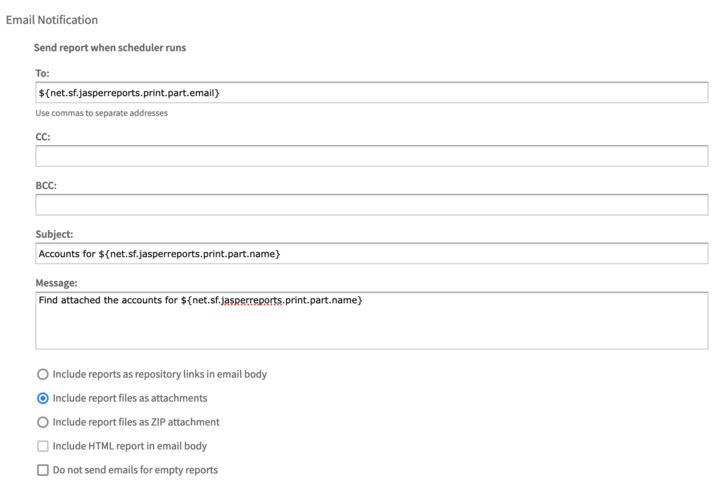
- Report splitting works with a single report that can be run in the JasperReports Server scheduler. The output is split into several parts and stored accordingly in the repository. Similar to Report Bursting, emails can be sent to different recipients. Read more here.
Jaspersoft Studio 8.2 and JasperReports Library 8.2
Excel Export Accessibility Compliance (WCAG AA)
WCAG AA compliance while using screen readers for Excel exports.
Excel and CSV Performance Improvements
While generating big Excel or CSV reports, there can be up to 60% performance improvements. Based on a new setting, JasperReports Library can allow skipping measuring string length for table and crosstab reports. This is useful when exporting Reports into data-centric formats, like Excel and CSV.
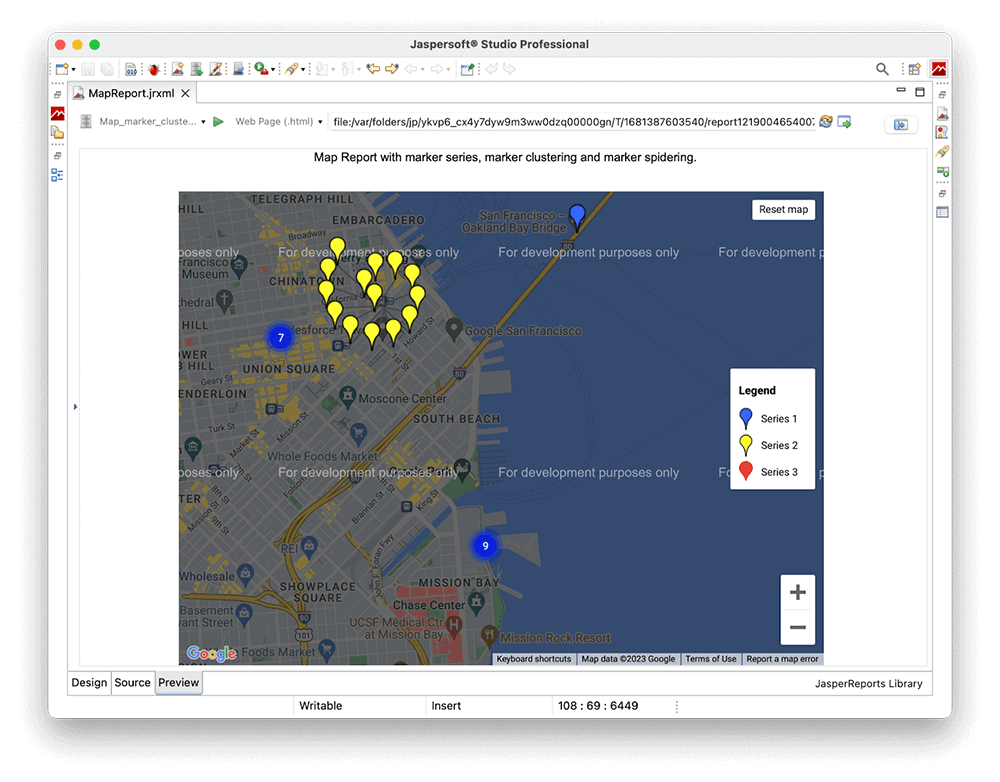
Marker Clustering in Google Maps
When designing a report in Jaspersoft Studio, Designers can use marker clusters to cluster the map markers. It helps clean up the user interface when running map-based reports and improves performance when dealing with large data sets of over 200,000 Map Markers. Such reports can be executed in JasperReports Library and viewed in JasperReports Server.
JasperReports Server 8.2
Security Improvements
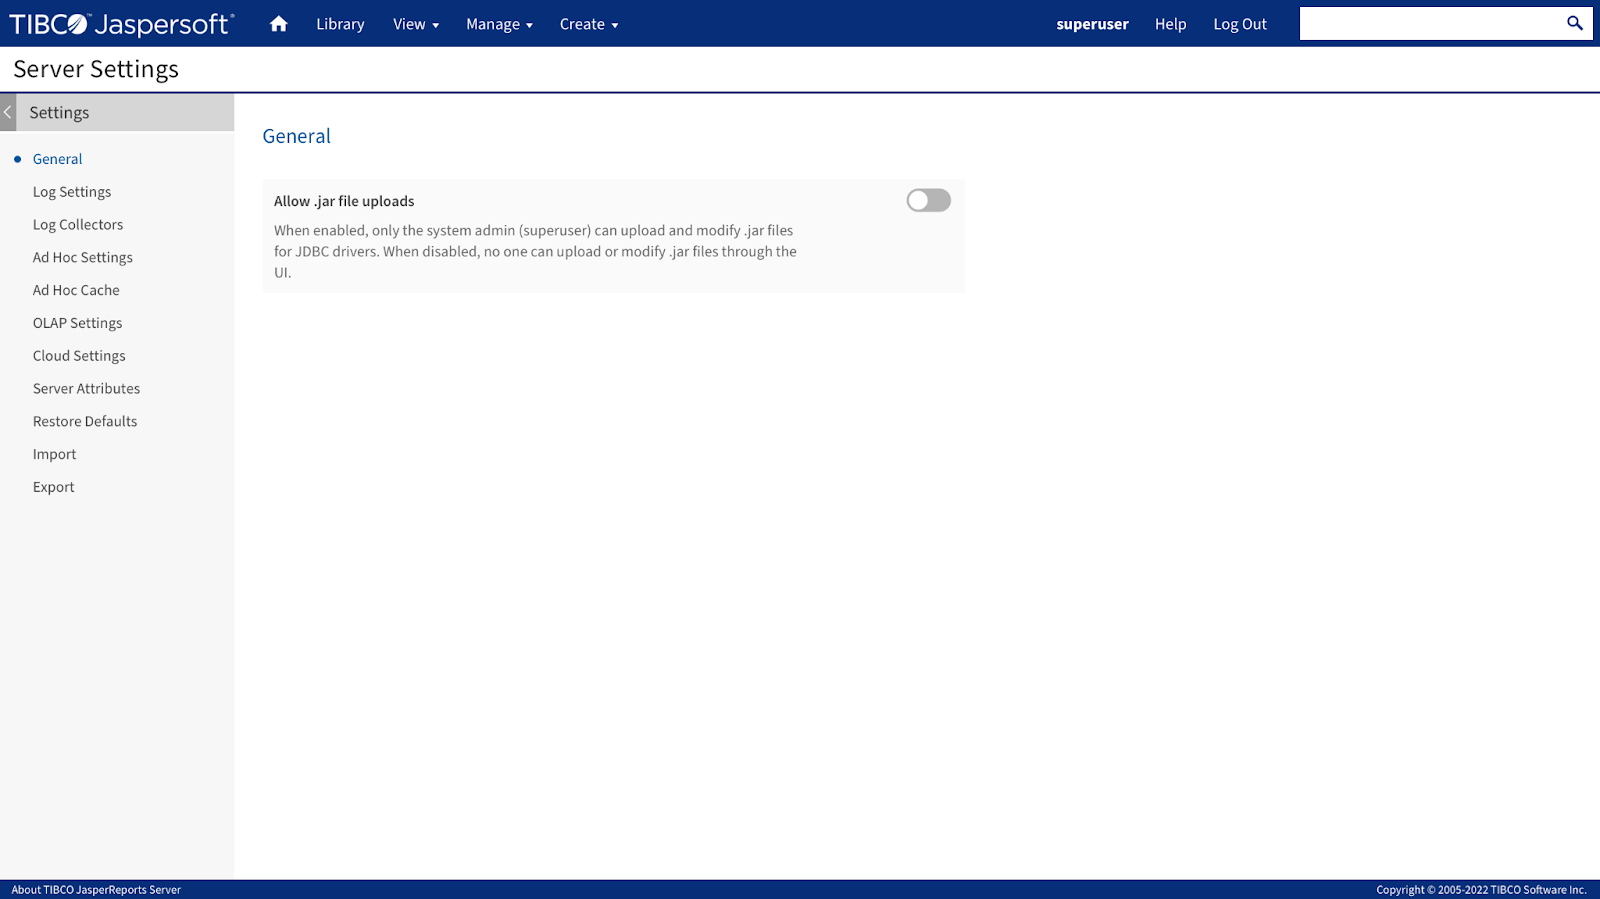
Server Setting to Upload Jar Files
Superusers now have an "enable upload jar" option in the Server Level Settings page. Superusers can enable this for themselves but have to do so consciously. This provides greater control over jar file uploads.
The jar upload option for Superusers is disabled by default.
Control Over Number of Failed Login Attempts
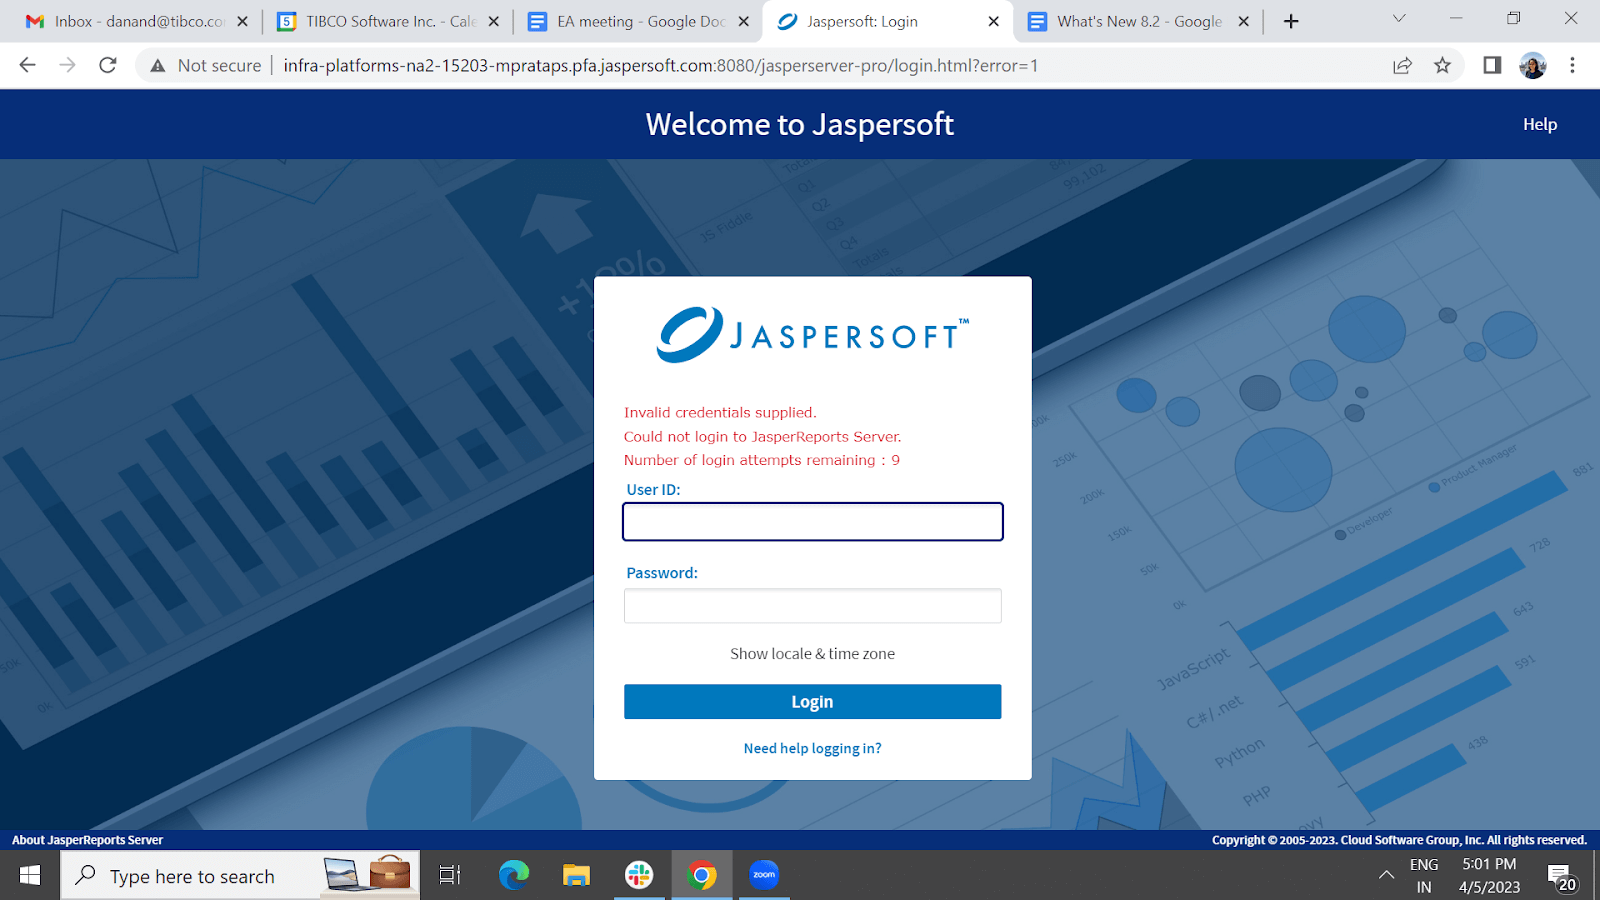
For security reasons, if a user enters an incorrect password multiple times, they can be locked out of their account. The number of failed attempts is enabled and set to 10 by default. The feature can be disabled and the number of failed attempts can be configured.
UI/ UX Enhancements
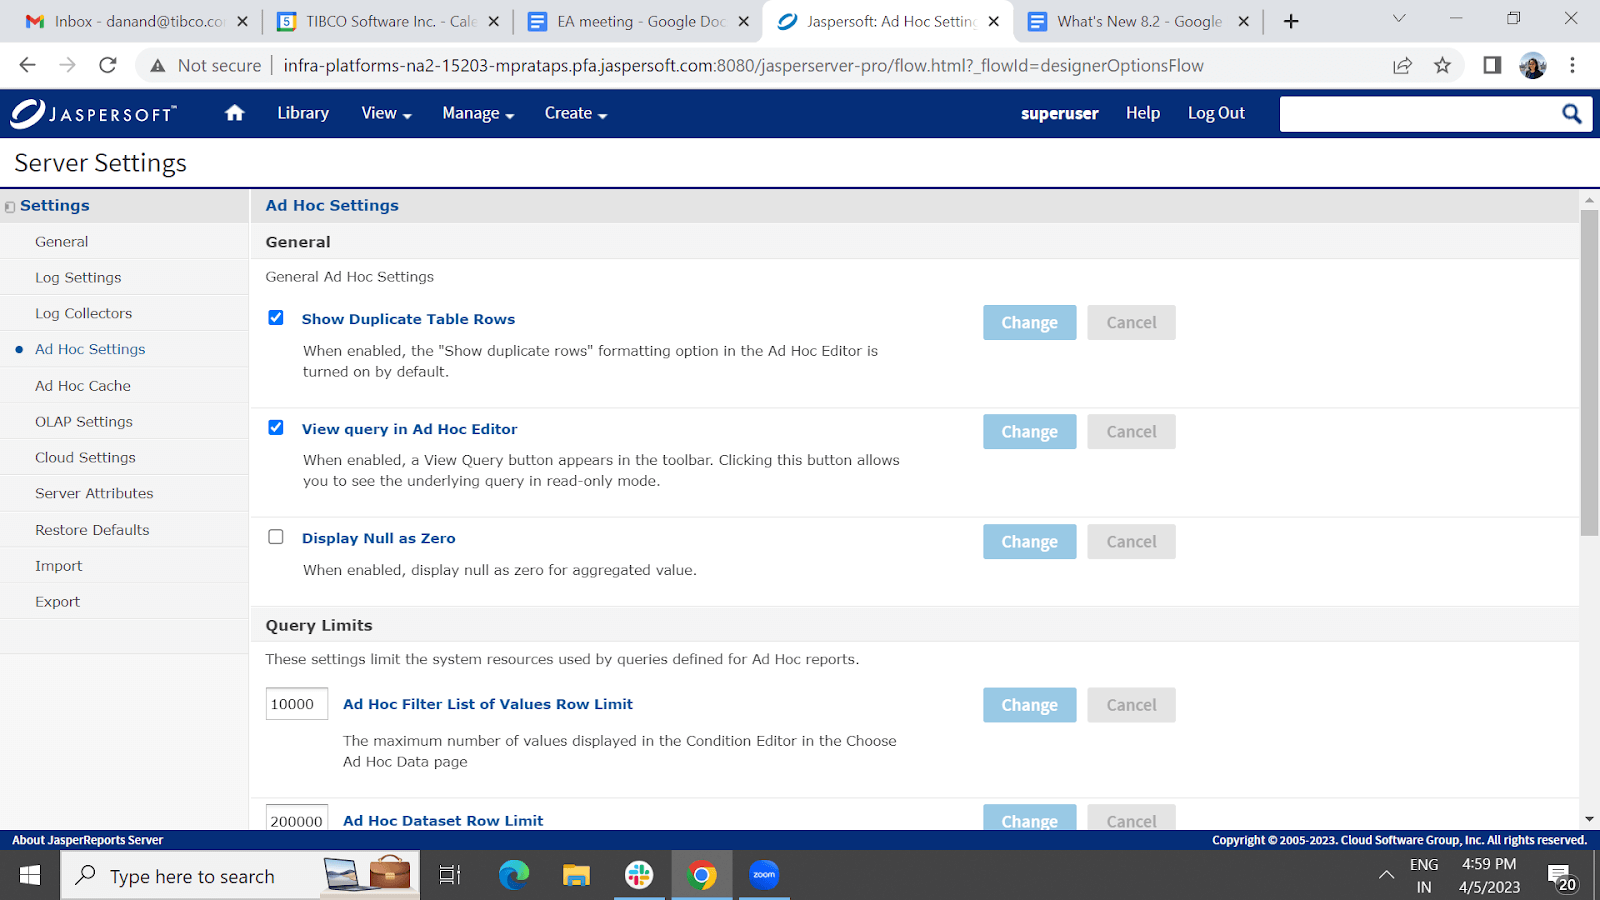
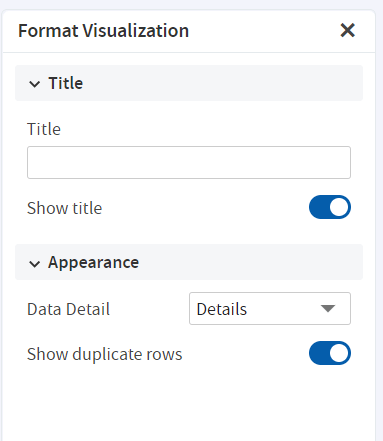
Server Setting to Show/Hide Duplicate Rows in Ad Hoc
Superusers can now decide the default behavior for Show/Hide Duplicate Rows in the Ad Hoc Designer. There is a new setting for this under Server Settings > Ad Hoc Settings.
Close Editors and Viewers to Navigate Back to Repository/ Library/ Search Results/ Home
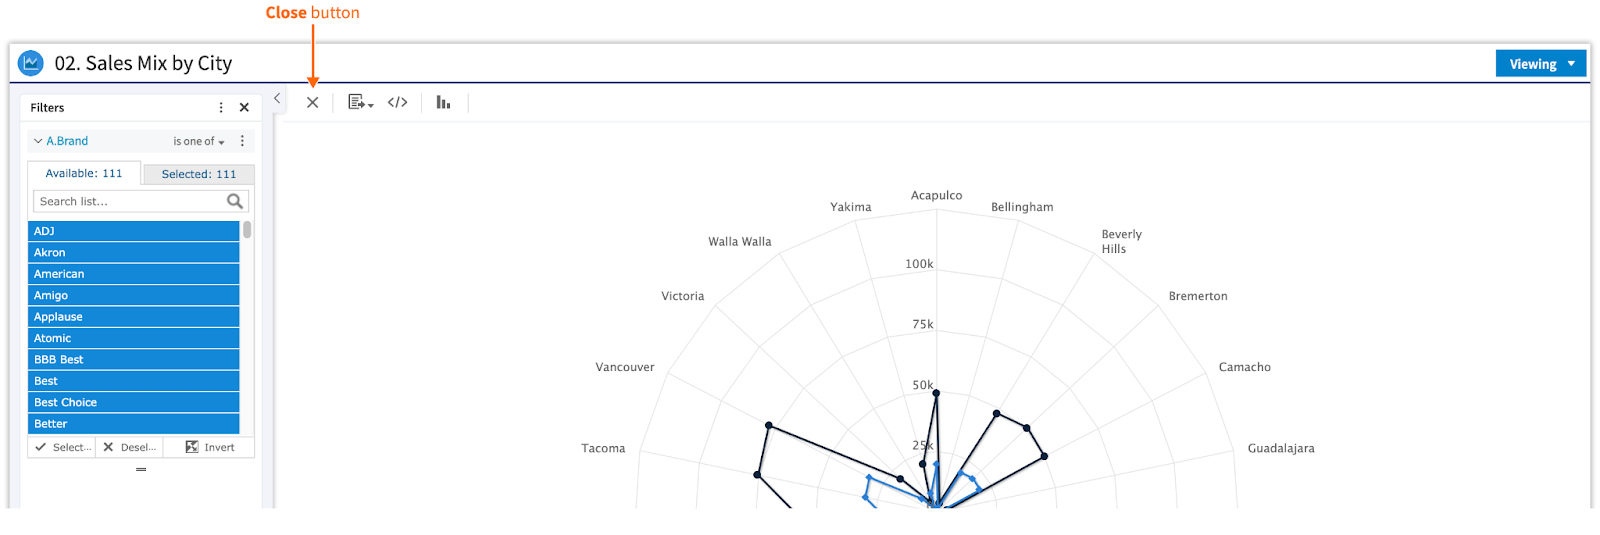
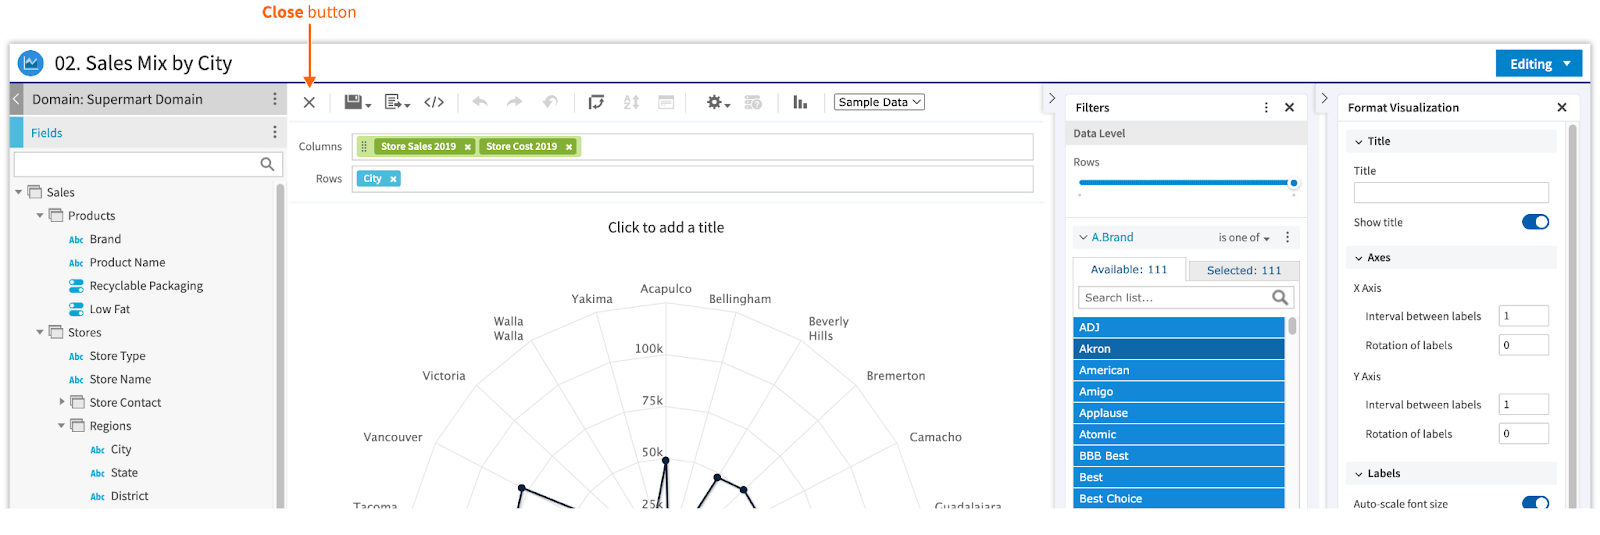
- For a better user experience, a new “Close” button has been added to the following resources: Domains, Ad Hoc Viewer, Ad Hoc Designer, Dashboard Designer, Dashboard Viewer, and Report Viewer.
- This helps users to differentiate between going back to a parent report (in case of Dashboards and Drill Down Reports) and closing an Editor/Viewer to go back to the Repository/ Library/ Search Results/ Home page.
- In case of embedding JaspersReports Server using Visualize.js or iFrames, the Close button in the Editor/Viewer ensures that navigation is not dependent on the browser “Back” button.
- To avoid losing unsaved work, users will be prompted to Save their resources while Closing an unsaved item.
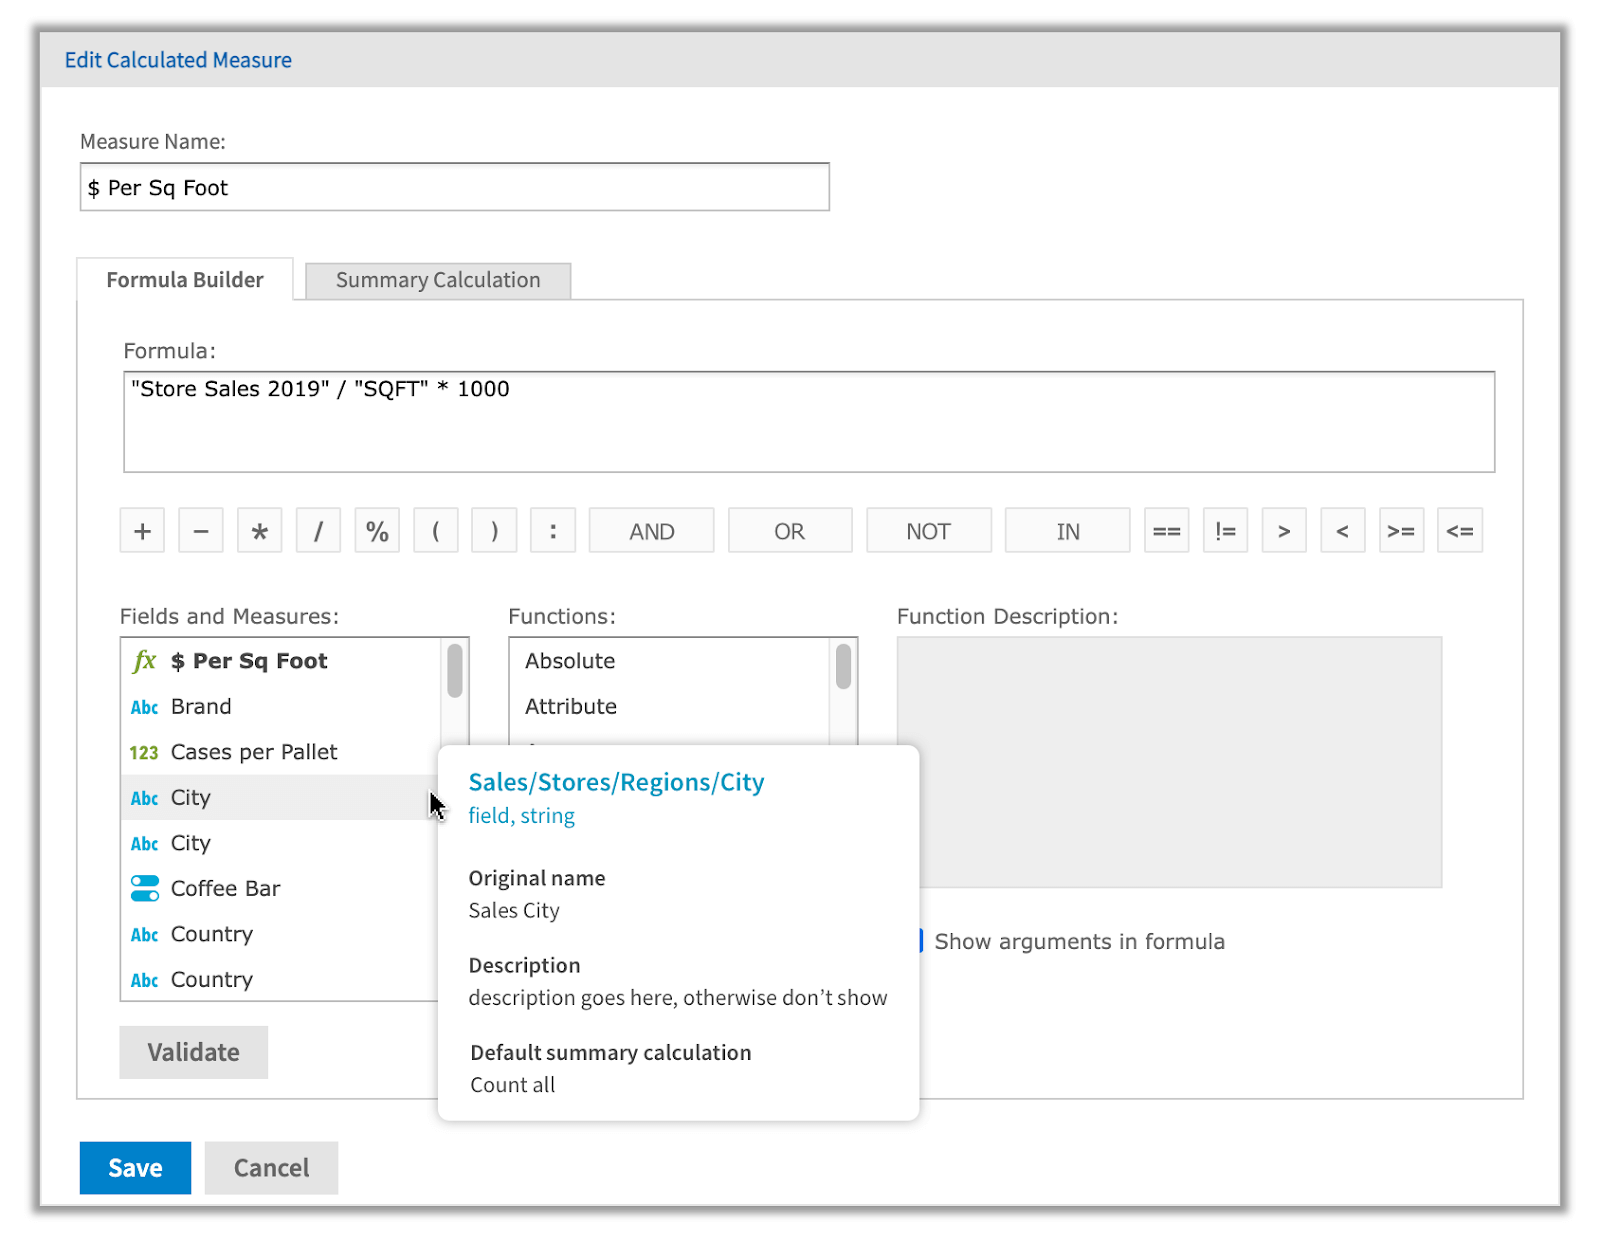
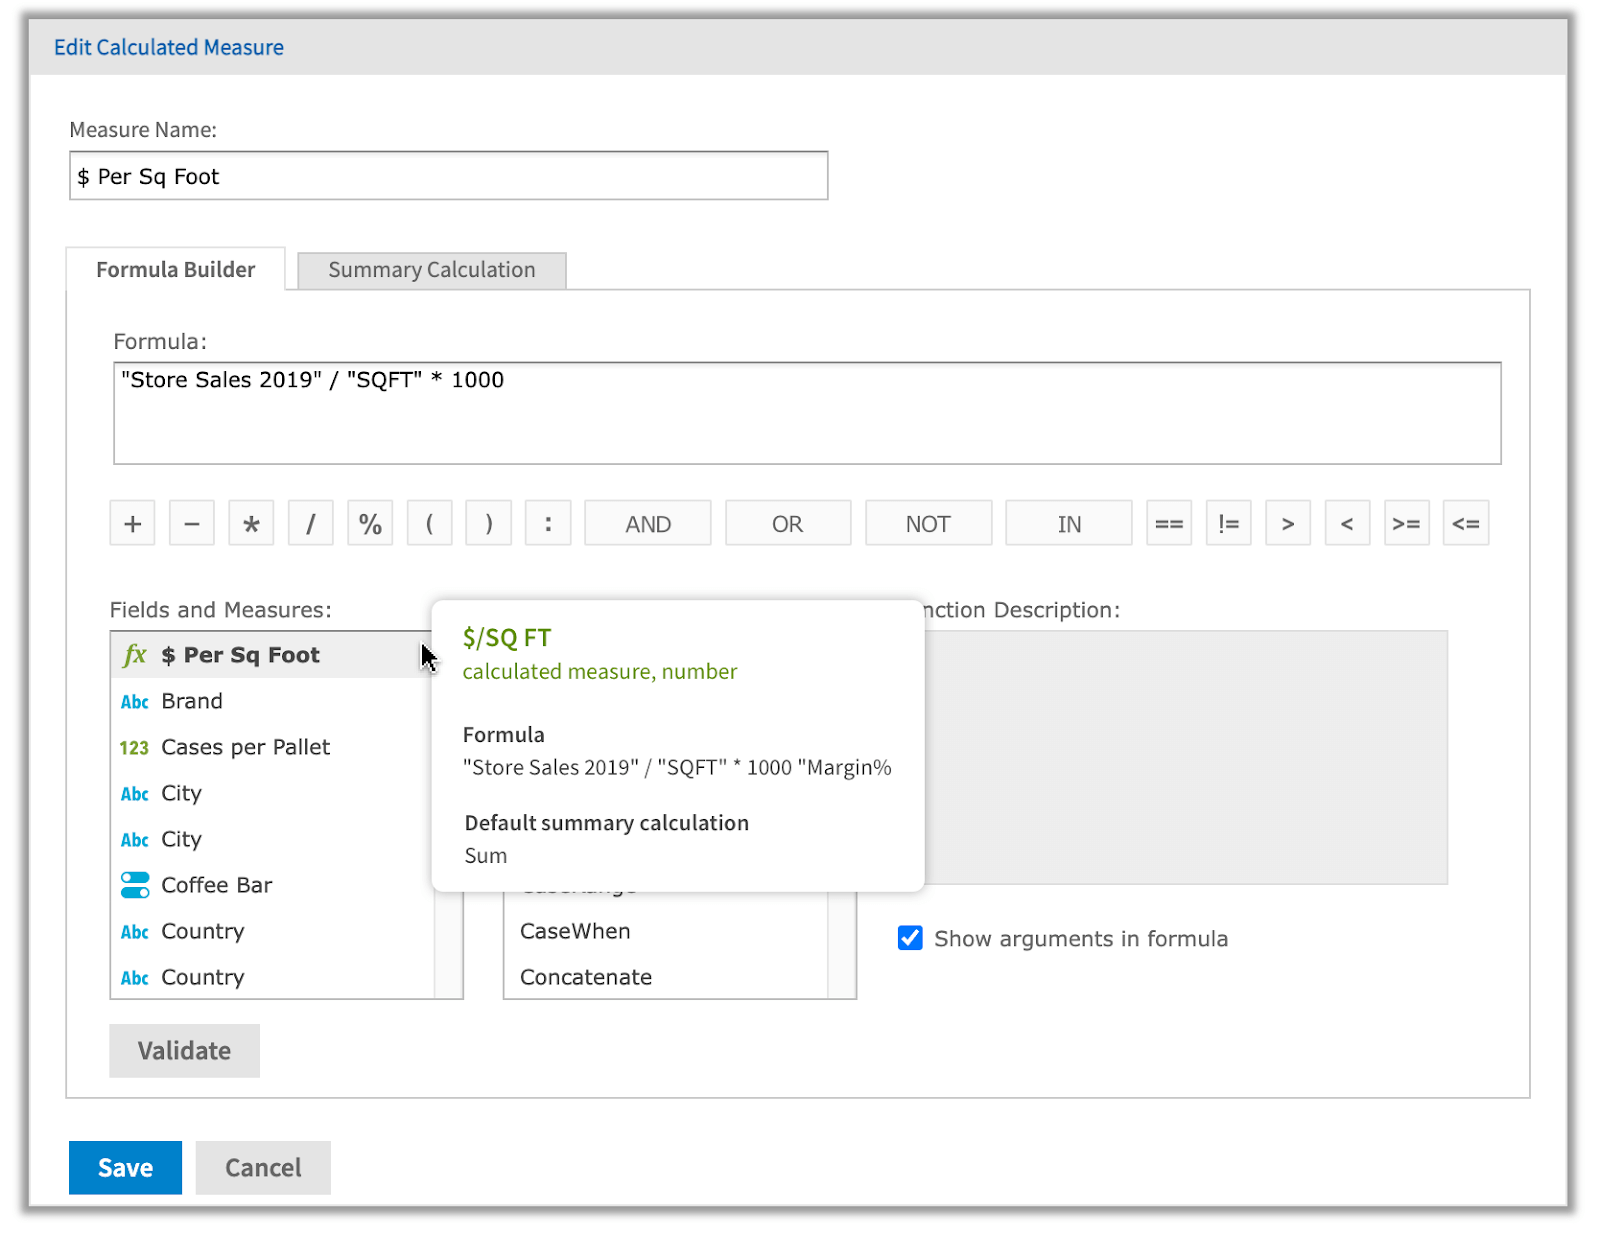
Informative Tooltip While Creating Calculated Fields in the Ad Hoc Designer
Users creating Calculated Fields in the Ad Hoc Designer can now see information about the fields and measures in a new tooltip. Earlier, it was hard to understand the source of the fields/measures being used while building formulae. Now, additional information is available, for example - the field path (to understand the origin of the data, the original name (in case the field name was changed), and the formula used (if another calculated field is in use).
Accessibility Compliance (WCAG 2.0 Level A and Level AA)
JasperReports Server (Login, Home, and Repository) is now compliant with Accessibility Guidelines as per WCAG 2.0 Level A and Level AA. To make Jaspersoft more accessible to people with disabilities, some pages can be accessed using keyboard navigation and screen readers.
Recommended Deployment Architecture to Handle the 3rd Party Cookies Browsers Policy
Apple has blocked all 3rd party cookies in Safari and Google Chrome will be doing the same. JasperReports Server Release 8.2 ensures that Visualize.js users can still use JasperReports Server seamlessly. The recommended architecture is illustrated here.
New Platform and Database Updates
- Added support for JDK 17 with Tomcat 9.x (Runtime Support)
- Added support for Windows 11, Windows 2022
- Added support for Red Hat (RHEL) version 8.x
- Hibernate upgraded to version 5.6 (for security reasons)
- Spring Security upgraded to version 5.7.2 (for security reasons)
- HighCharts 10
- Upgraded from version 6.1.1 to 10.1.0
- Highcharts “back” button replaced with the built-in breadcrumbs feature in Highcharts 10.1.0
- Replaced iText library with LibrePDF OpenPDF 1.3.30 in JasperReports Library
For the complete list of new and updated Connectors and Platforms, please refer to the link.
Cloud Updates
- Support for AWS ECS. Read more about it here.
- JDK 17 Support in js-docker
- Docker version updated
- Kubernetes version updated
- Bug fixes and readmes updated in js-docker
For the complete list of items in the Jaspersoft 8.2 release, you can refer to the Release Notes here.
Jaspersoft 8.1 (08/2022)
JasperReports Server 8.1 Updates
UI Improvements
There are multiple UI/UX updates through the Ad Hoc Designer
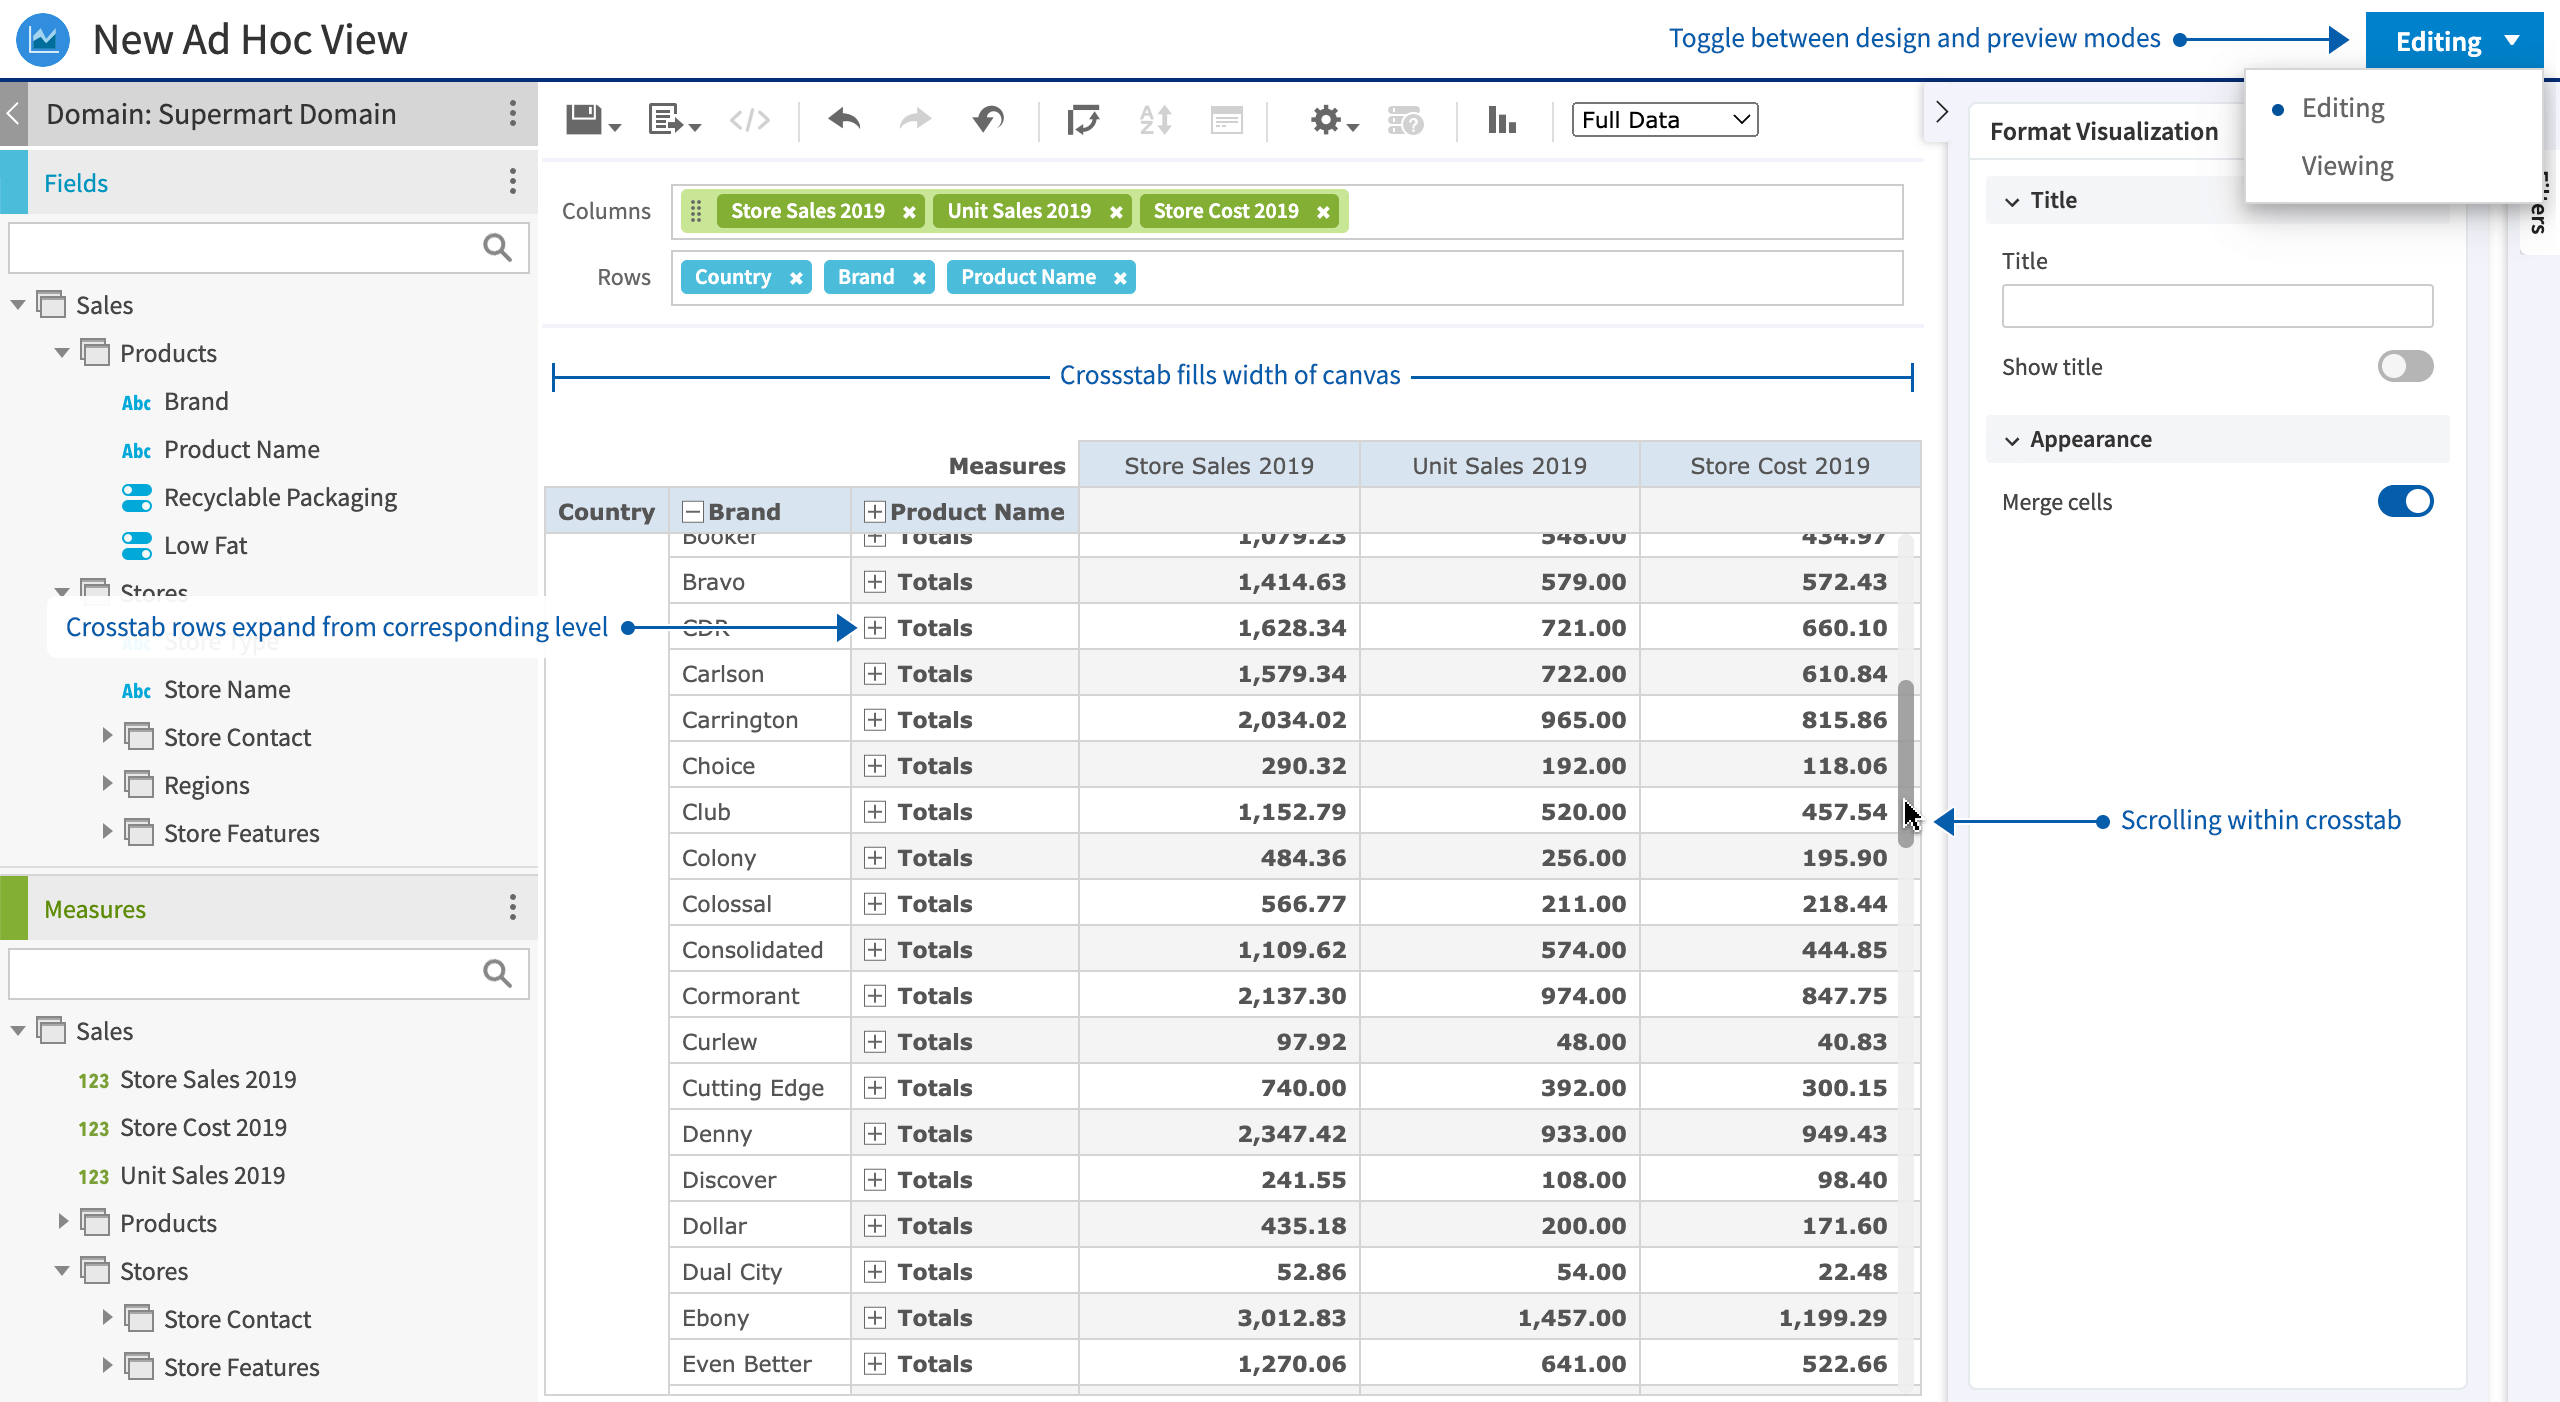
- When creating Cross tabs for the first time, there is a new pop-up window: Add a measure to continue. Nothing will appear on the canvas until you start adding measures.
- The Cross tab now fills the entire width of the canvas so that columns can be wider. Previously, column widths were automatically sized to fit its content.
- Expand/collapse behavior for rows now expands or collapses per cell, instead of automatically expanding or collapsing the subsequent cells.
- For very wide canvases or Cross tabs, the scrolling is now on the Cross tab itself, instead of on the canvas.
- The Preview toggle button is now moved from the toolbar to an Editing/Viewing toggle button on the Title bar in the top-right of the window.
- For Charts, you can now switch between Sample Data, Full Data, or No Data. Previously, the option was only available for Cross tabs and table visualization types.
User Favorites
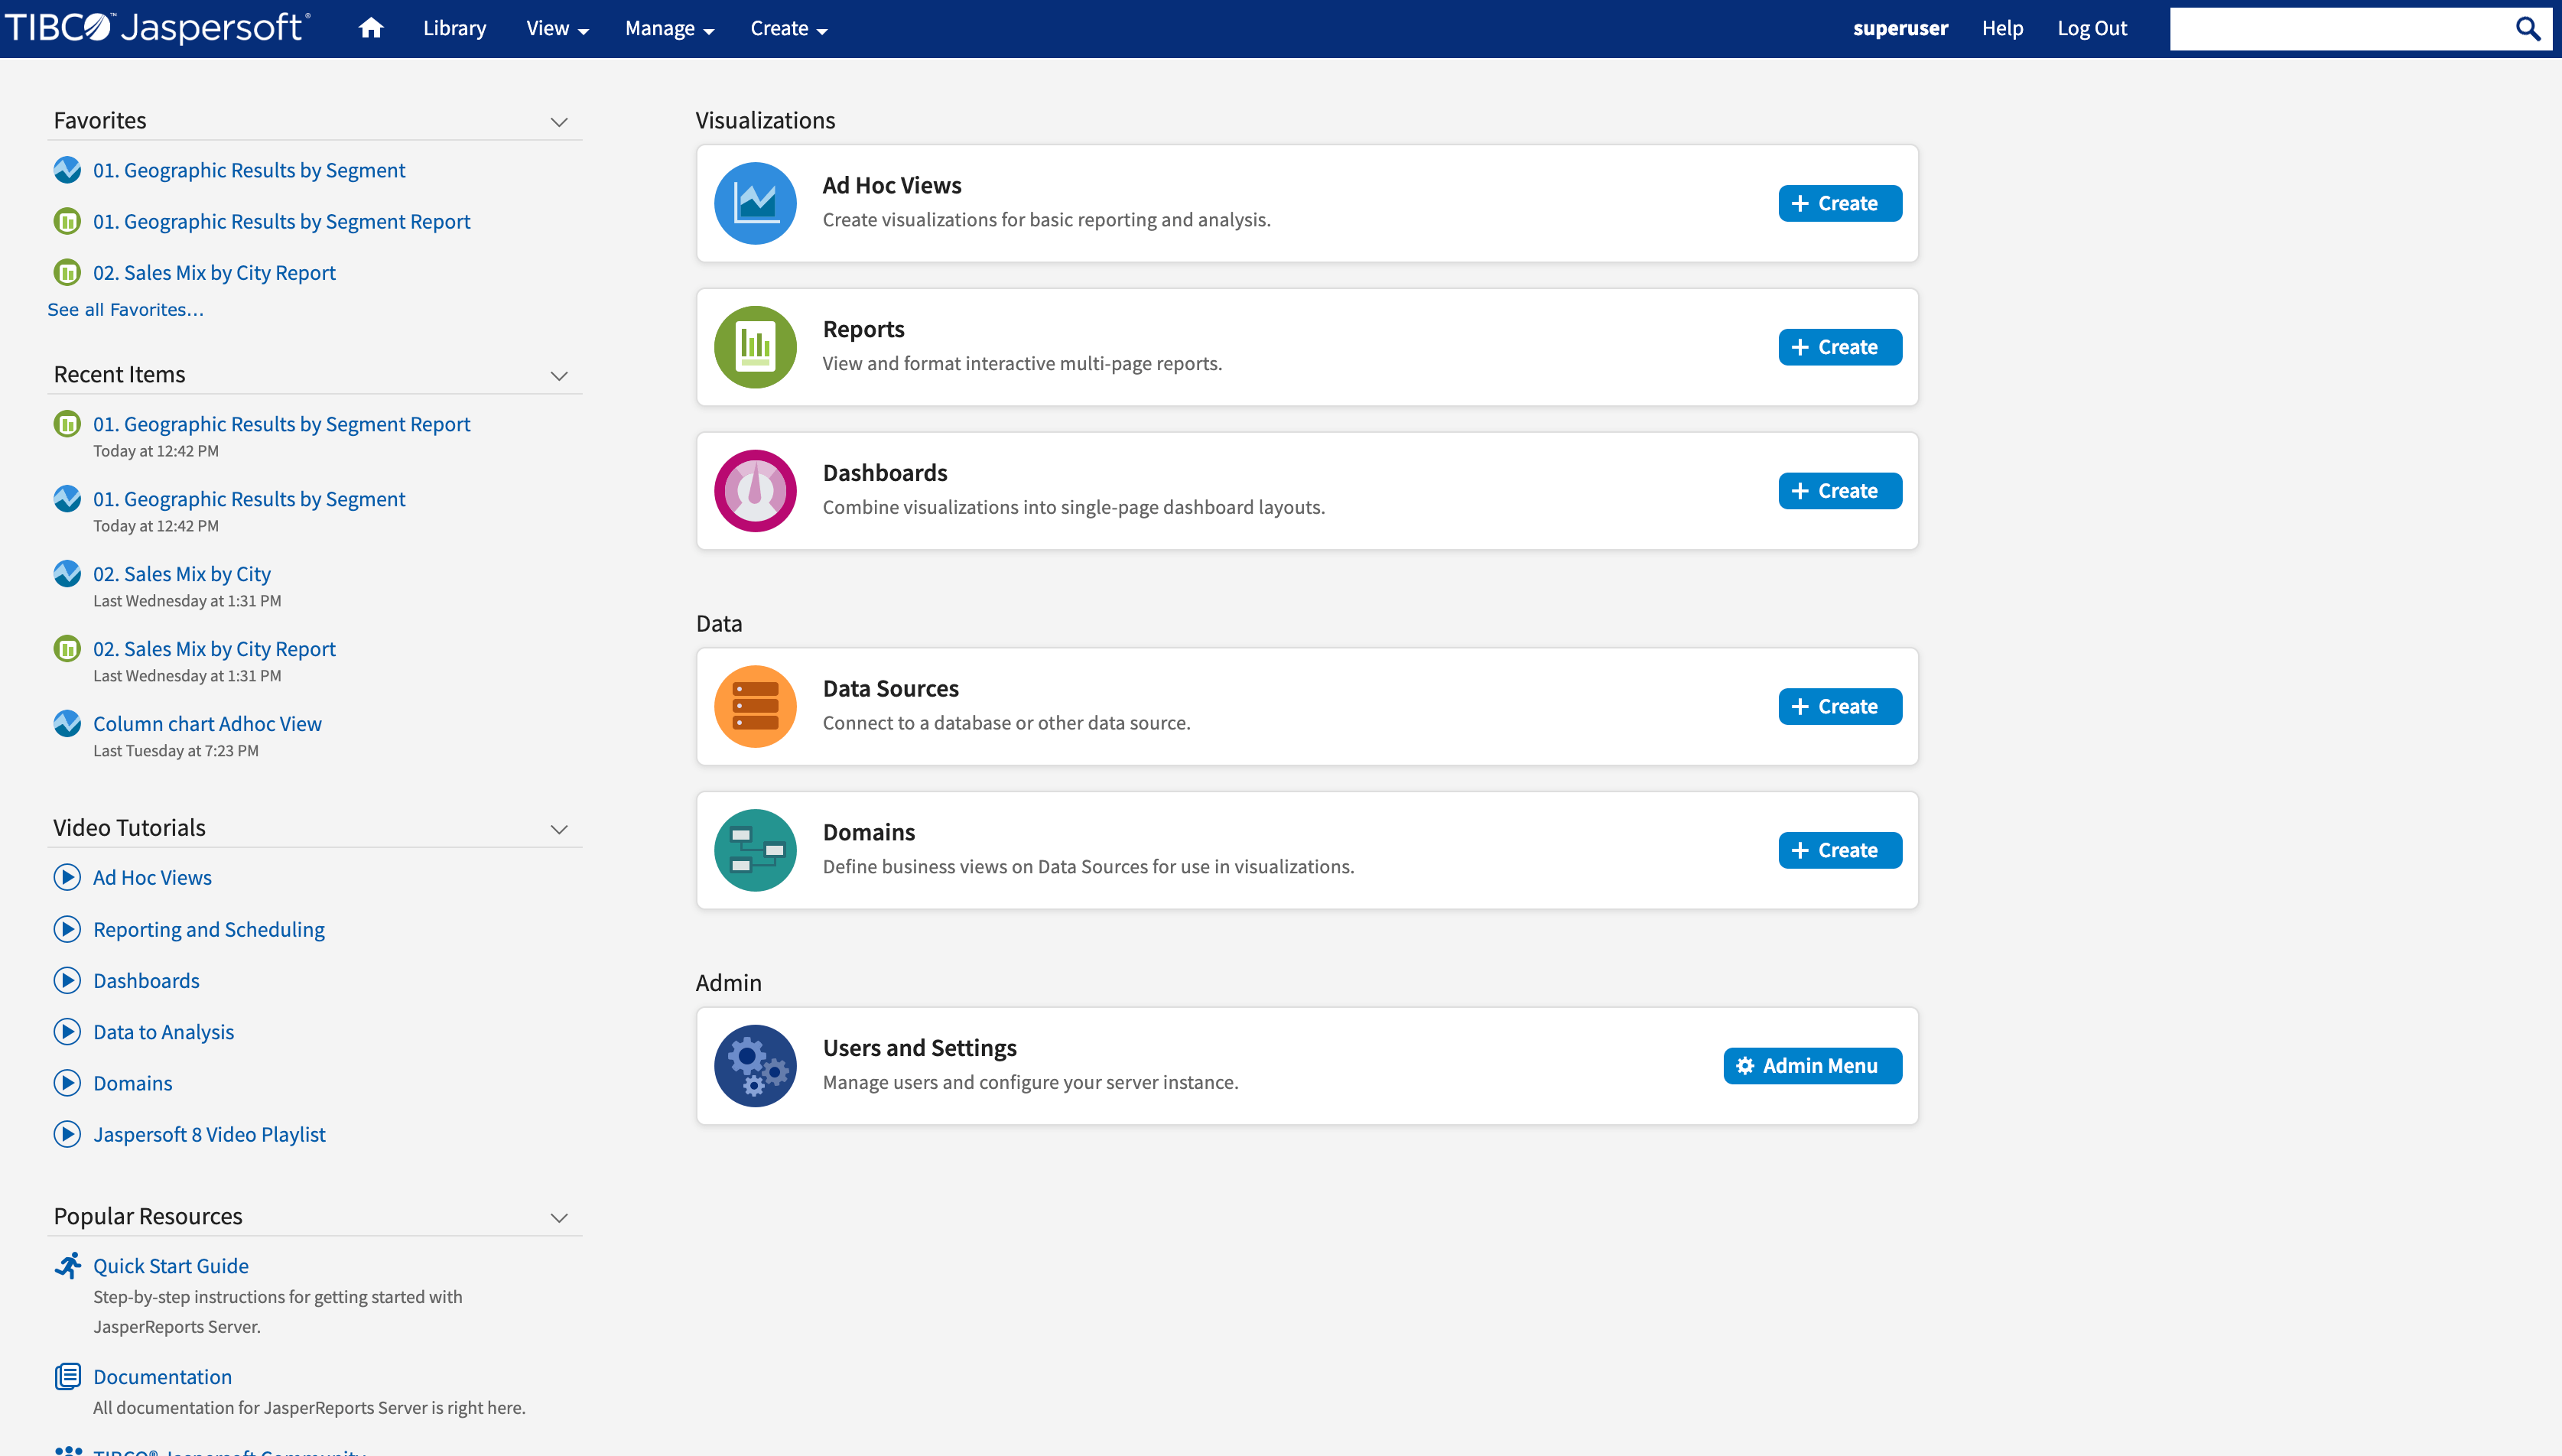
Users now have the ability to mark their resources as favorite ones so that they can easily find them. This feature is available for both CE and Pro users. This feature enable users to:
- Designate a resource as a favorite
- Remove the favorite designation from a resource
- See a list of all favorites
Server Monitoring
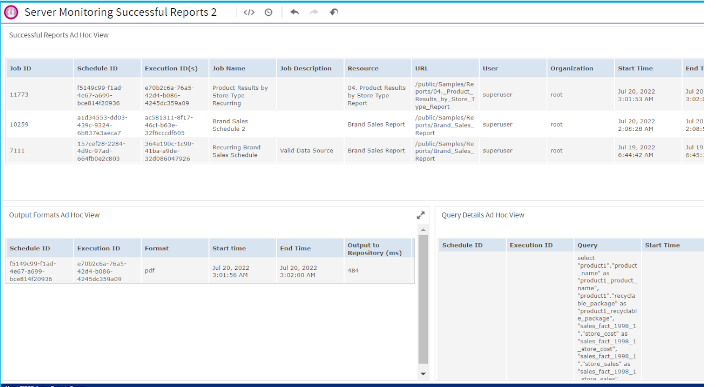
Server Monitoring now includes Ad Hoc Views with information about all scheduled report executions (successful or failed).
Views can also be used in Dashboards or to create reports. This feature is only available on JasperReports Server Enterprise Edition with enabled Audit.
Super users see all data for their instances. Jasper Admins see all data only for their organization.
Admin Console Beta
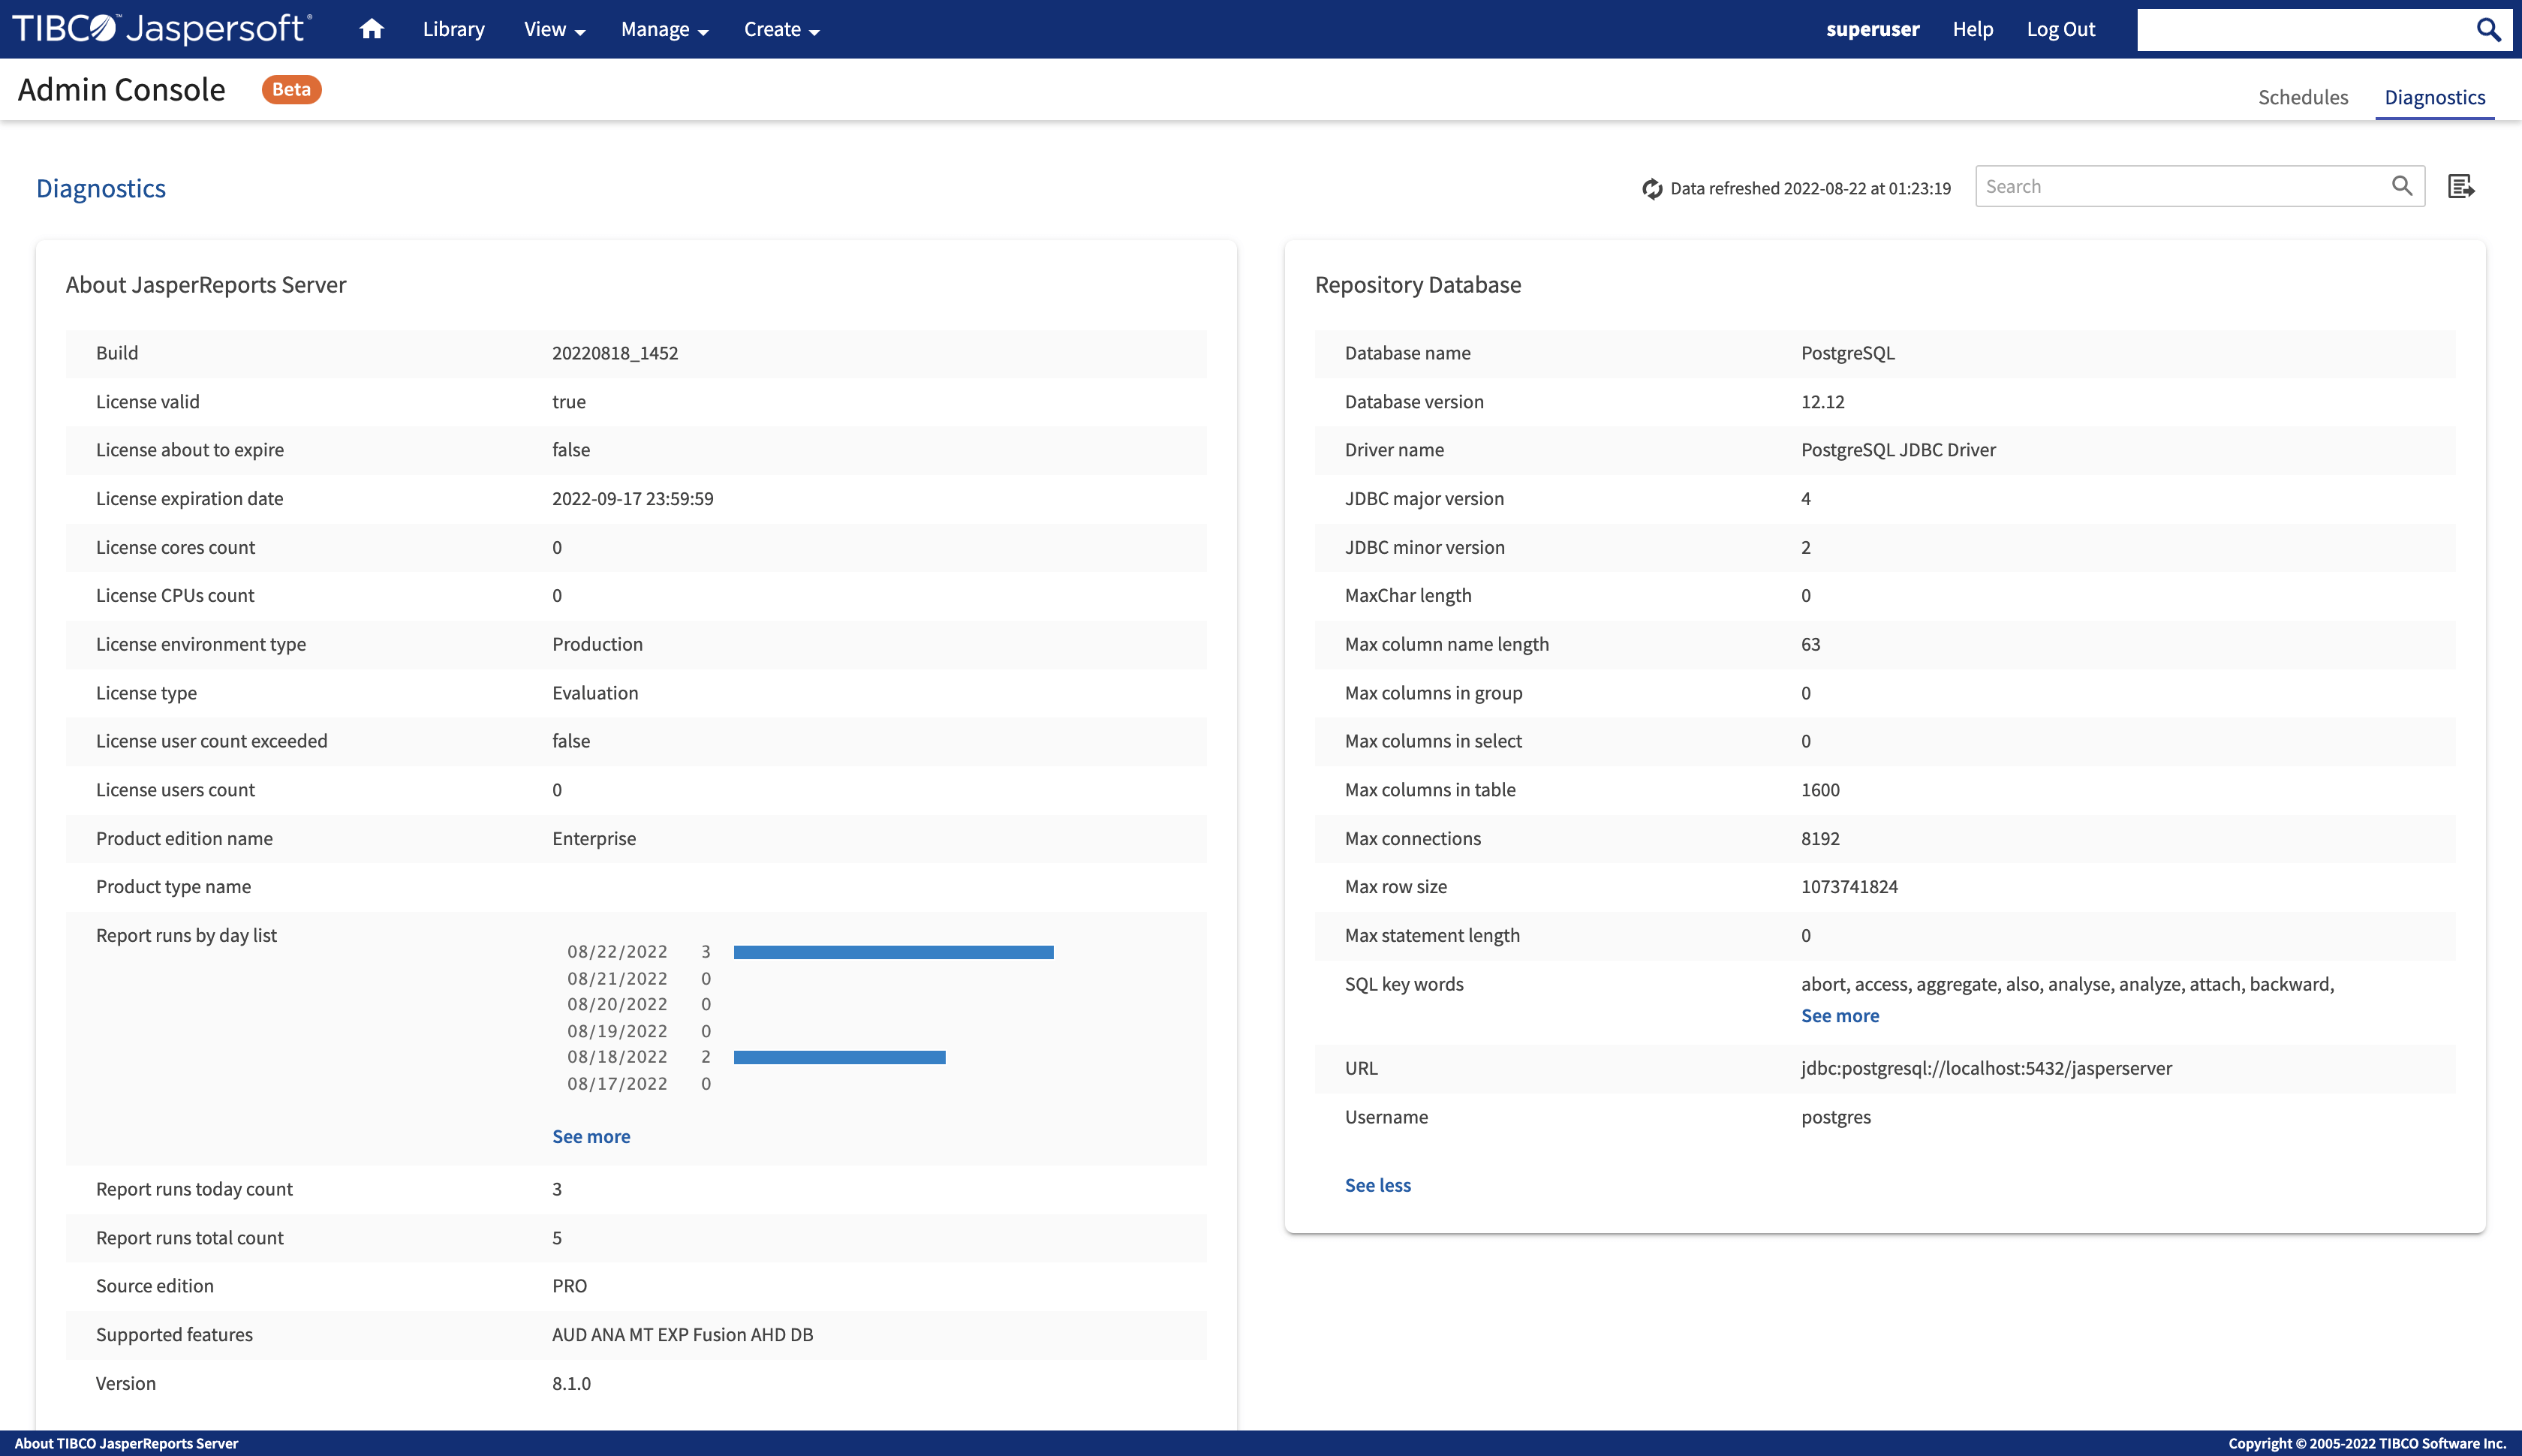
A new console interface that allows Administrators to quickly view and control the system. This beta feature is only available on JasperReports Server Professional Edition, and is enabled by default. Super users have access to Schedules and Diagnostics Tabs.
Jasper Admins only have access to Schedules for users under their organization.
For more information, visit Jaspersoft Community.
Report Bursting
Report bursting is the process of running a report at once and distributing its data to different recipients relevant to them. Bursting a report needs a list of recipients to whom you want to send the burst report and a bursting report containing a scriptlet attached to its dataset. This bursting report triggers the bursting operation. When you run a bursting report from the repository, it triggers the burst operation. The burst report that you want to send to recipients is stored in the output folder in the repository.
OpenTelemetry Support for Tracing of Report Executions and Input Controls
JasperReports Server now has support for OpenTelemetry, which can be used to enable tracing of JasperReports export executions and input controls. Tracing can be used to investigate performance problems with JasperReports Server. This feature is available for both CE and Pro users.
Jaspersoft Studio and JasperReports Library 8.1 updates
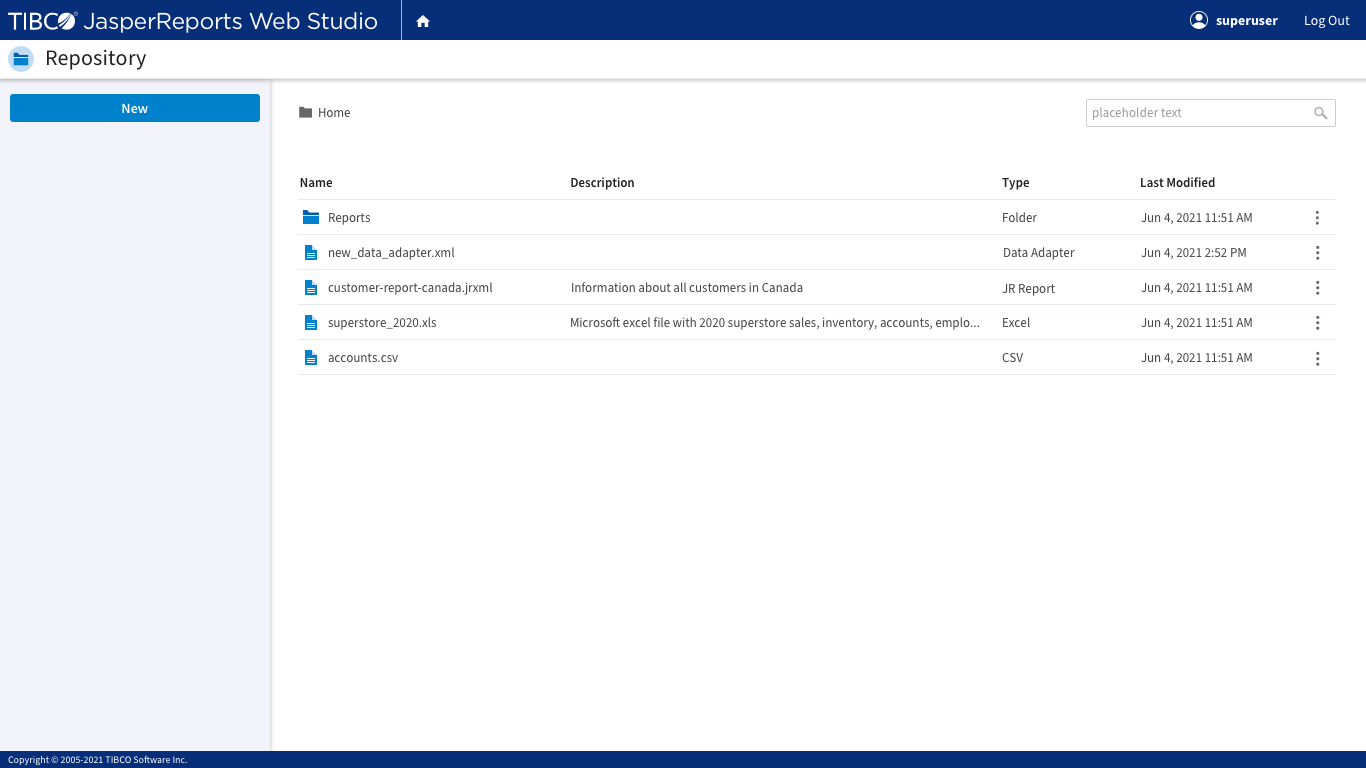
JasperReports® Web Studio - Professional Edition
- Stand-alone JasperReports® Web Studio - Professional was released independently and announced along with Jaspersoft 8.0.2.
- With Jaspersoft 8.1.0, you can integrate JasperReports® Web Studio - Professional with JasperReports Server. Now with a couple of clicks in JasperReports Server, you can edit your Reports on the web.
Accessibility for HTML and PDF exports
We have made HTML and PDF reports export accessible as per the WCAG guidelines.
New Platform and Database Updates
- MacOS 12 (Monterey)
- OpenShift
- PostgreSQL 13, 14
- Elasticsearch 8.2.0
Other Updates
Security Fixes
There are cumulative security fixes including updates for Log4j and Spring Framework.
Jaspersoft ETL Updates
Jaspersoft ETL 8.0.1 and Jaspersoft ETL - Extended Big Data 8.0.1 is now available.
Please refer to the following Release Notes for what's new and what's changed:
- Jaspersoft ETL 8.0.1
https://docs.tibco.com/products/tibco-jaspersoft-etl-8-0-1 - Jaspersoft ETL - Extended Big Data 8.0.1
https://docs.tibco.com/products/tibco-jaspersoft-etl-extended-big-data-8-0-1
Jaspersoft 8.0 (12/2021)
JasperReports Server 8.0
UI Improvements
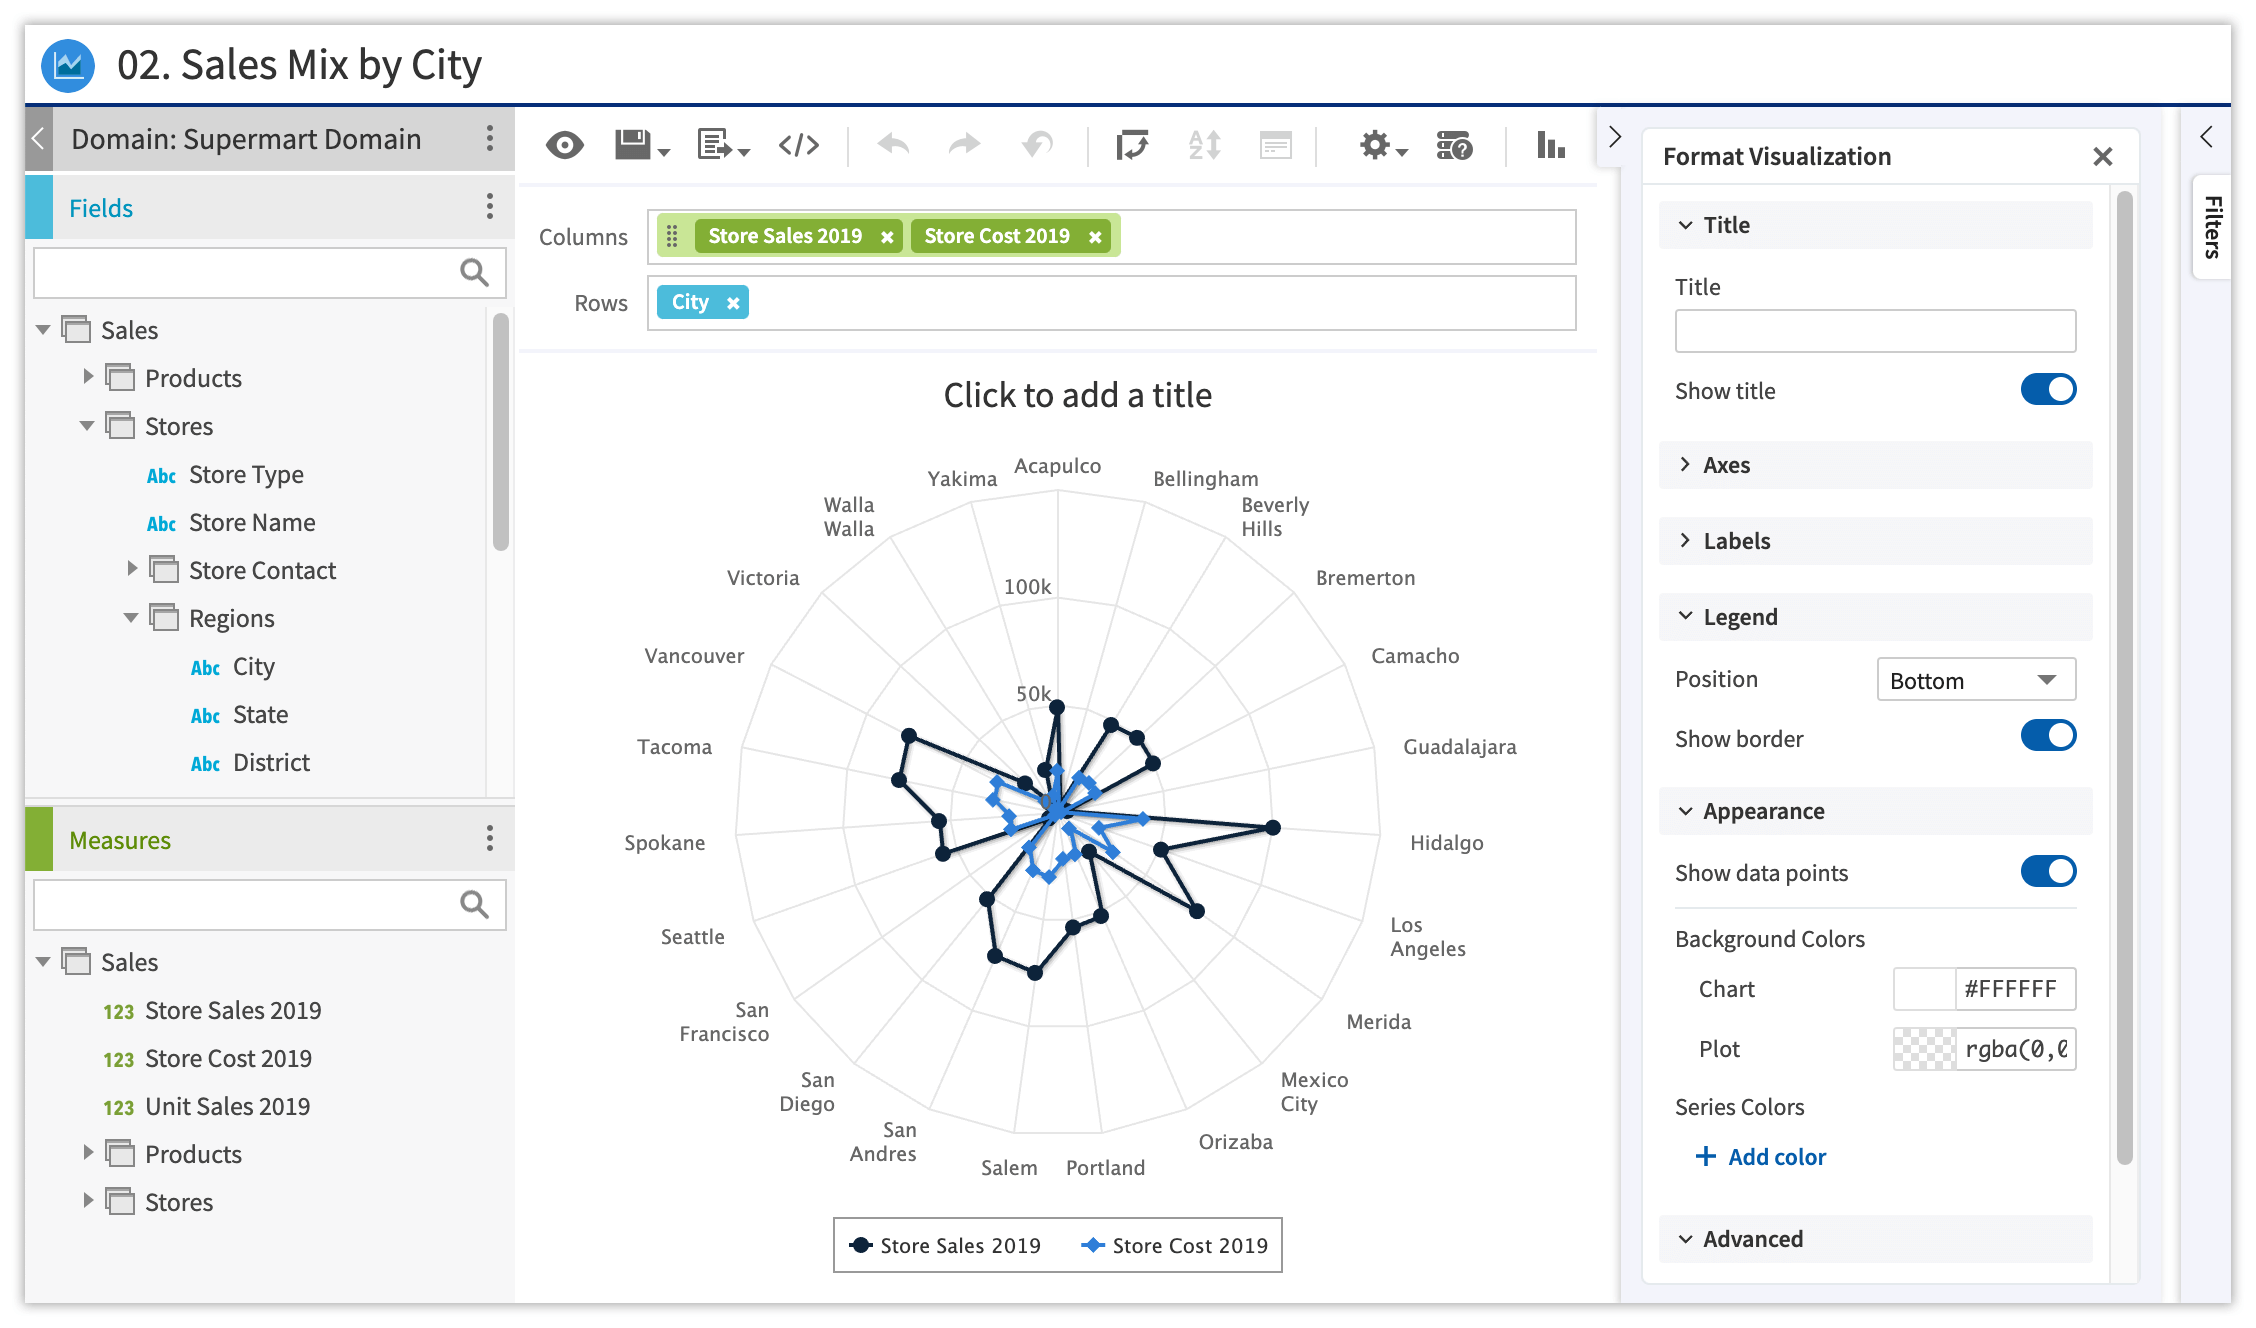
New settings panel dedicated to formatting and properties in Ad Hoc and Dashboard designers.
Scalable Query Engine
It is a microservice application that allows you to offload Ad Hoc Queries execution from JasperReports Server to a separate service, which allows you to minimize on JasperReport Server nodes provisioning and quickly scale up where there is a peak load to on your system and scale down where there is no demand in Ad Hoc.
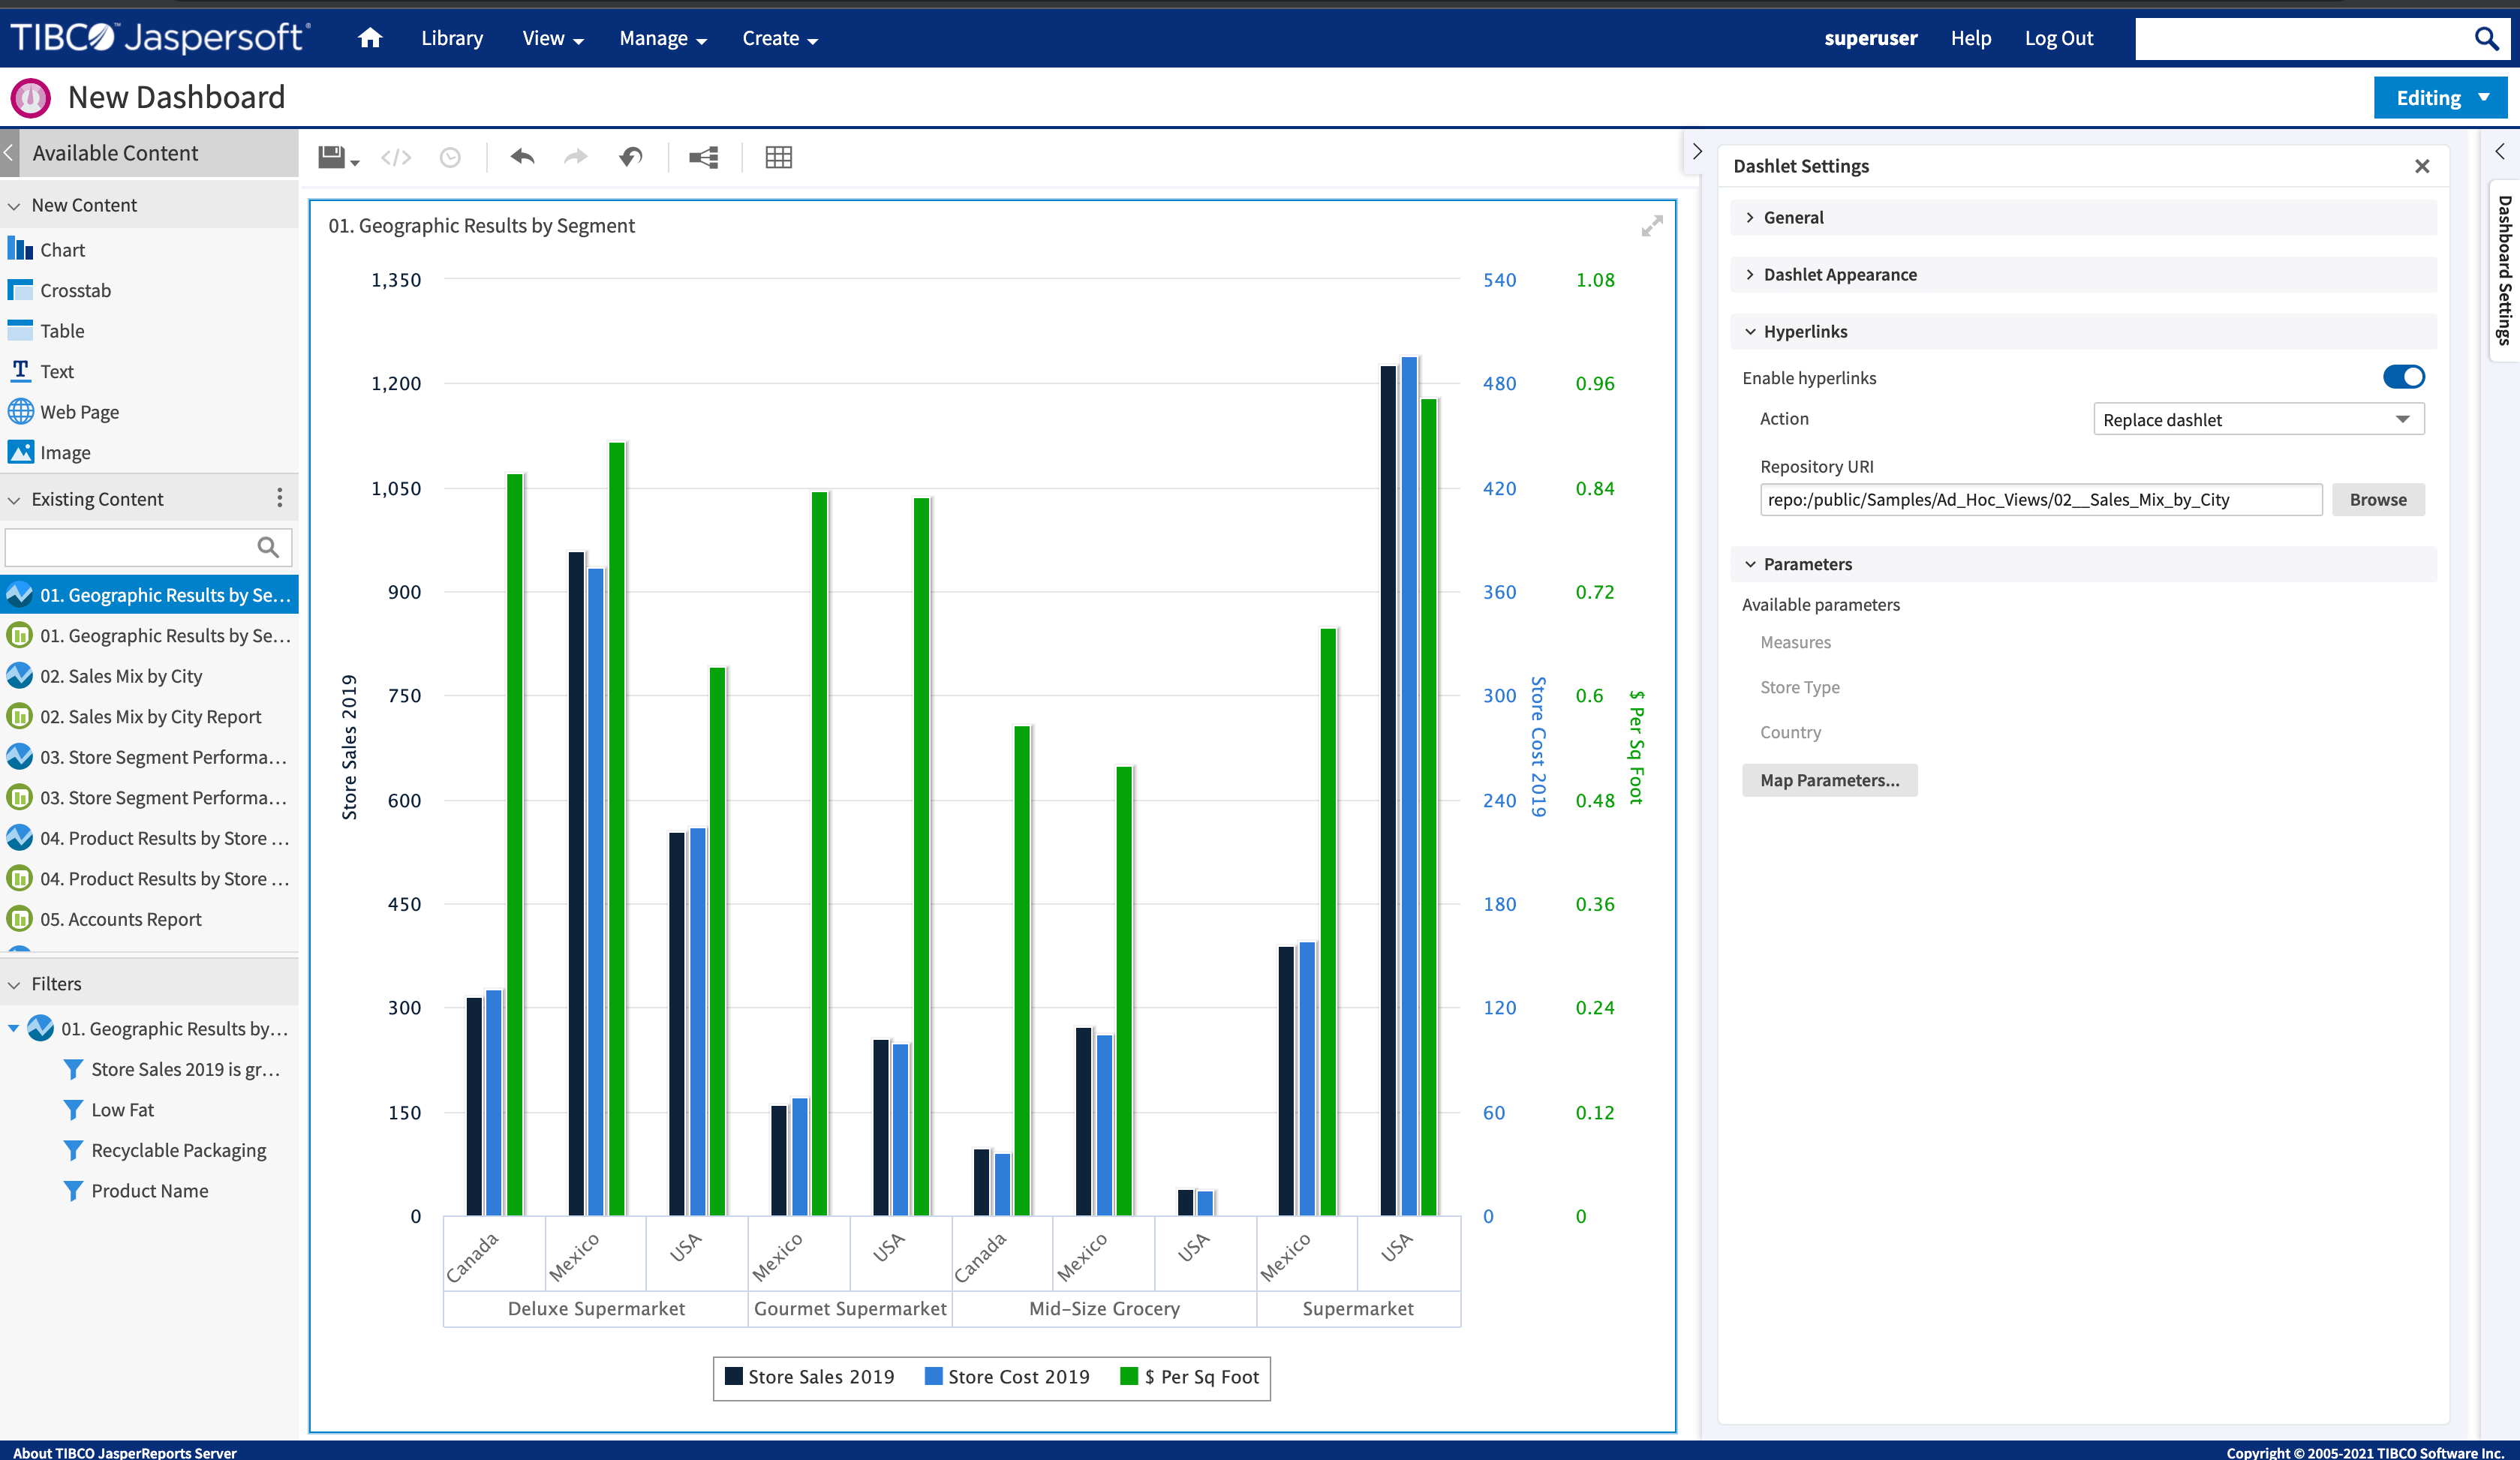
Hyperlinks
Hyperlink Settings have been added for Crosstab & Table Ad Hoc view dashlets in Dashboards.
New Replace dashlet option
Has been added to Enable hyperlinks settings for Ad Hoc view dashlets, which enables replacement of the Ad Hoc View in a dashlet with some other Ad Hoc View, Report, or Report Option.
Externalize Audit & Access Events
Audit and Access events can be moved to different databases using split installation/upgrade, which improves performance of the JasperReports server and simplifies future upgrades and migrations.
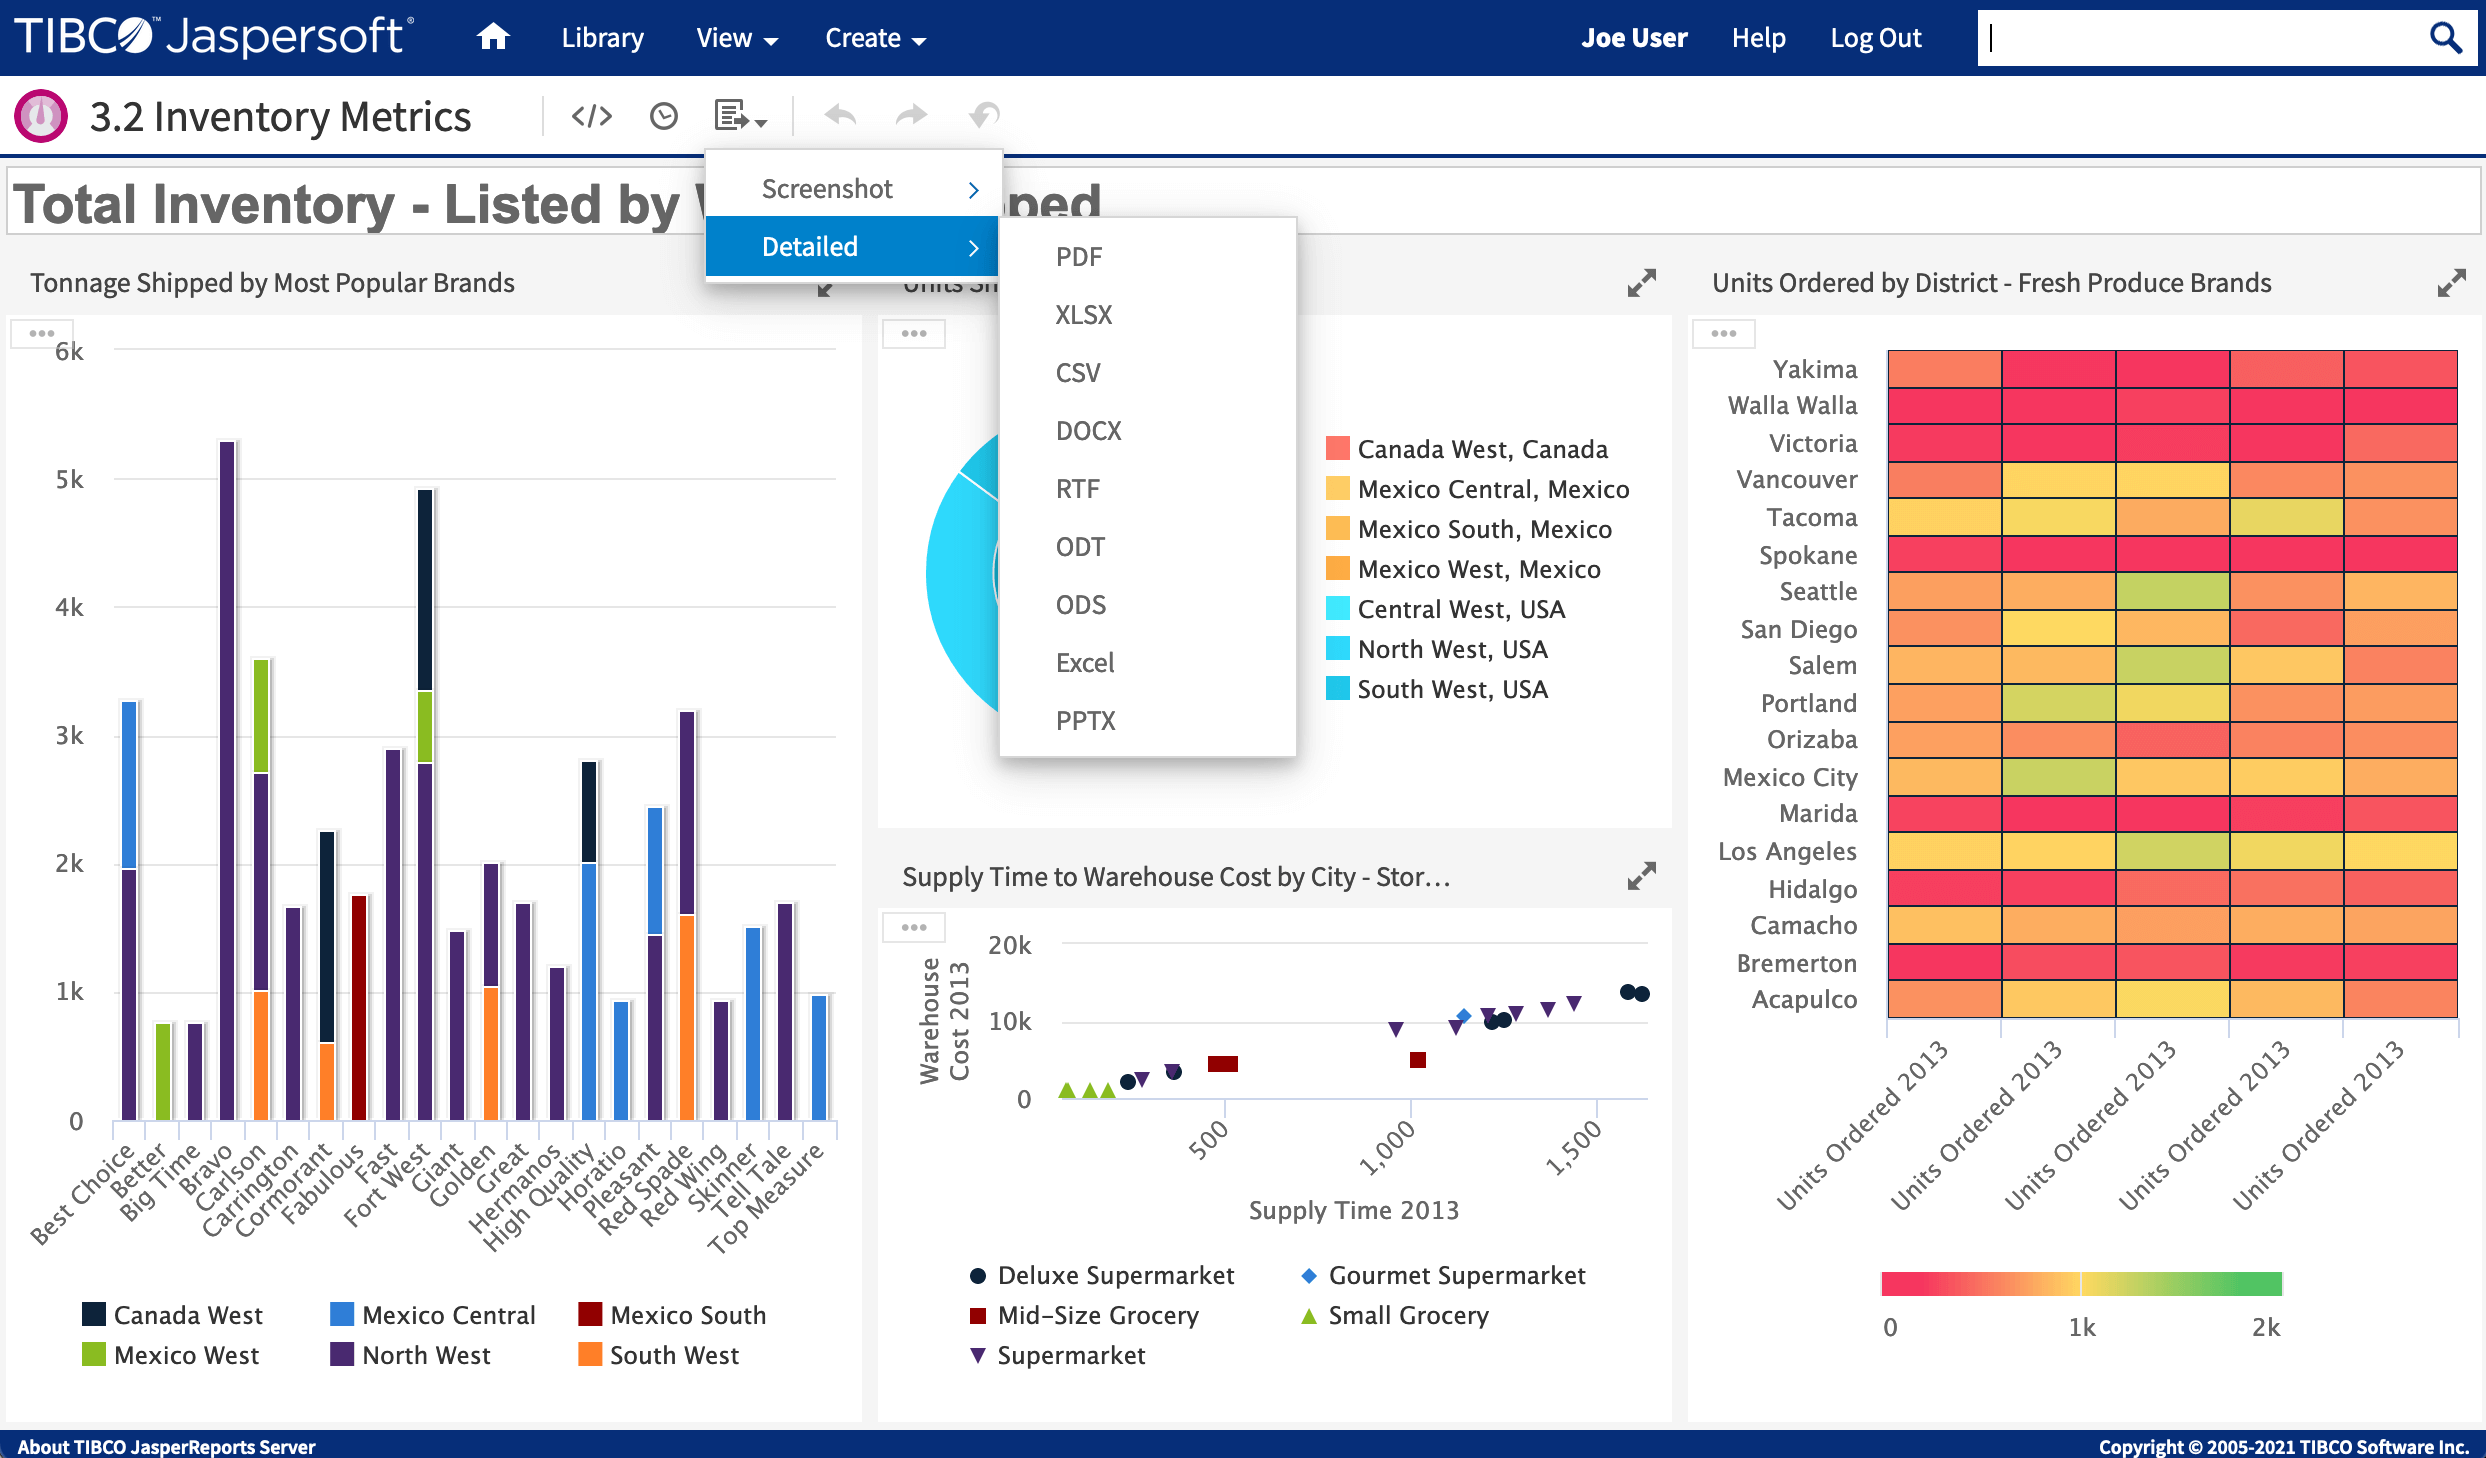
Detailed Dashboard Export
Dashboards in JasperReport Server can be exported as an image & in detailed mode with each visualization (dashlet) in a new page. This feature is available in Dashboard Viewer, Scheduler, and Visualize.js.
Docker and Kubernetes support for JasperReports Server deployment
JasperReports Server now supports deployment on Docker and Kubernetes. For more information, refer to the Jaspersoft Docker Repository at https://github.com/TIBCOSoftware/js-docker
Jaspersoft Studio and JasperReports Library
JasperReports® Web Studio - Professional Edition (Beta)
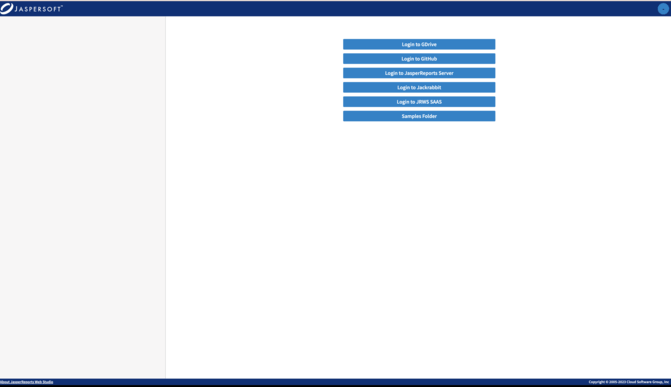
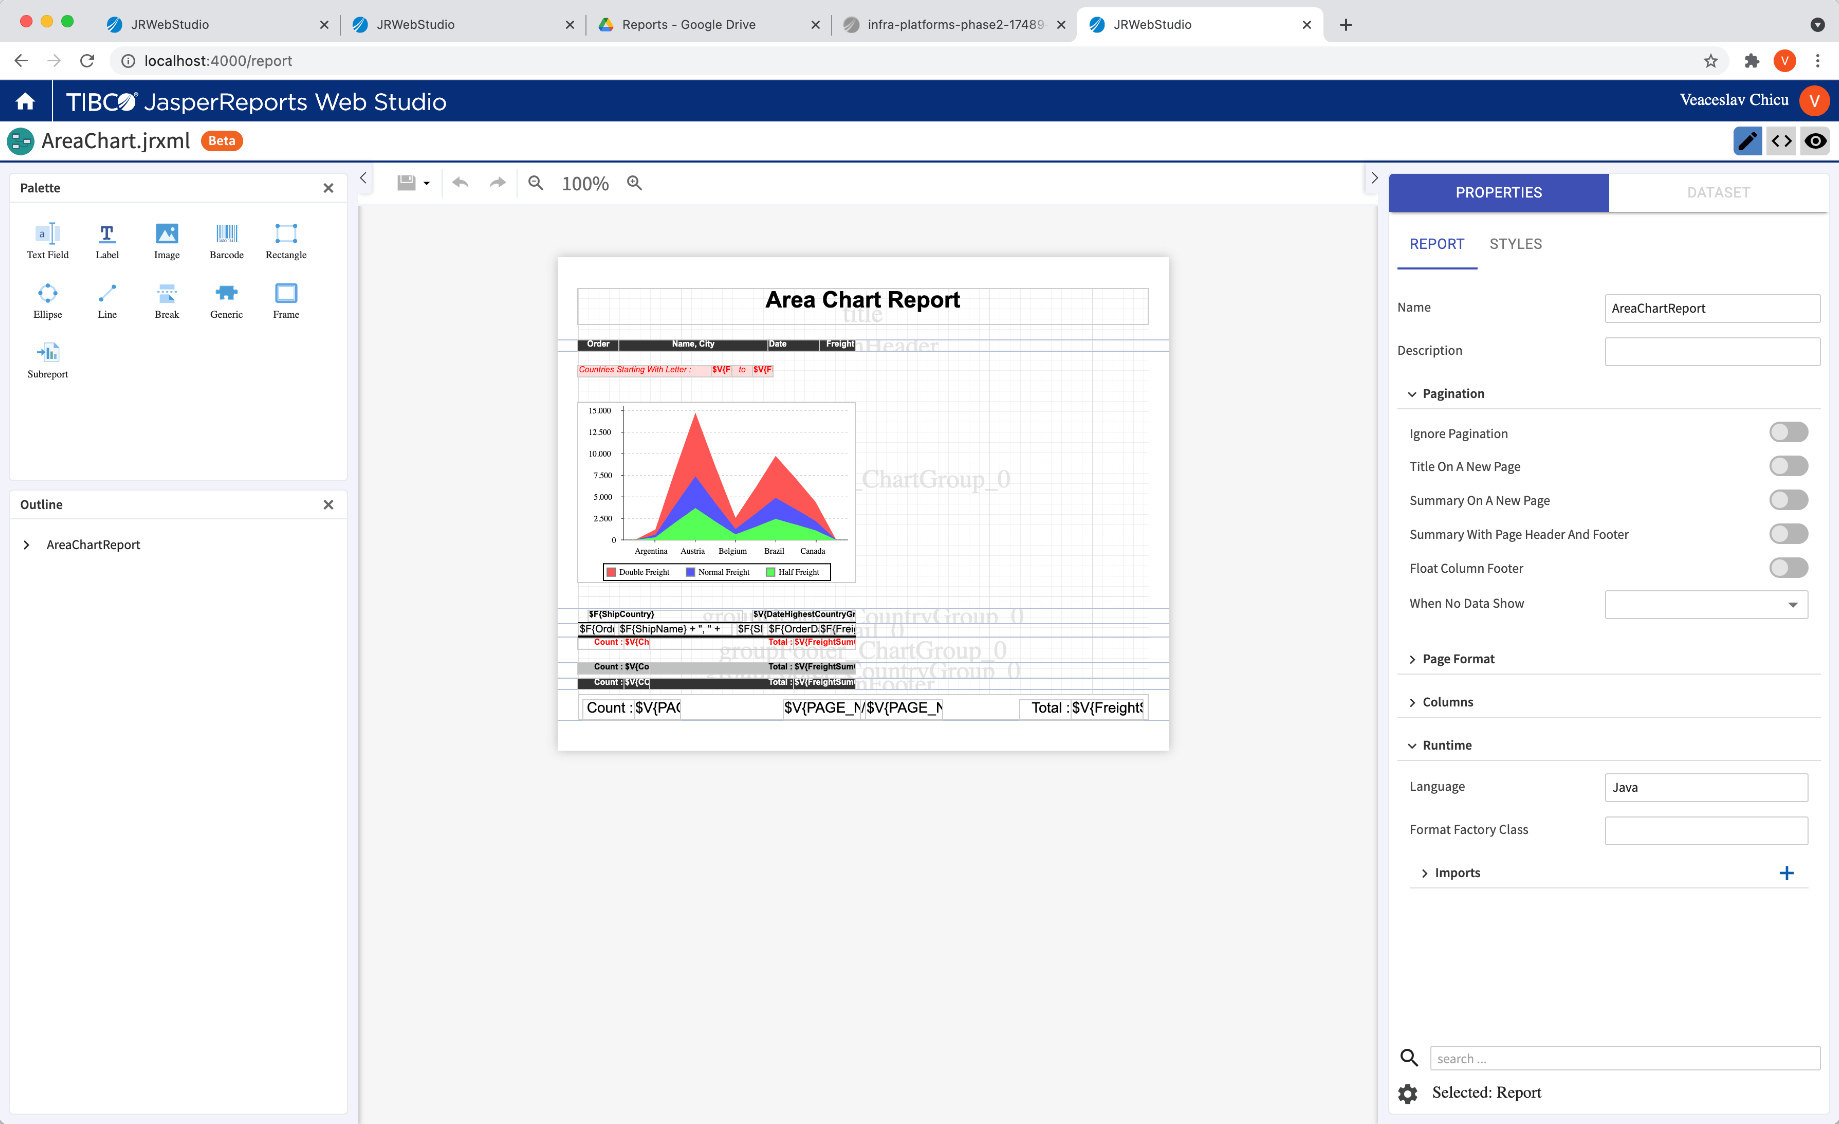
This release comes with the much-awaited JasperReports Web Studio - Pro edition. This allows users to design and test pixel-perfect reports in a fully web-based version that is fully compatible with the powerful desktop version. Standalone version can work with a remote JasperReports Server, Google drive using a google account or Github repository. Report templates (jrxml) editor allows you to edit source code, design reports visually, and preview the report with JRIO.
For more details on Jaspersoft web studio please refer to the Knowledge Base or please reach out to JS product team if you want to access Beta software.
High Maps Support in JasperReports Library
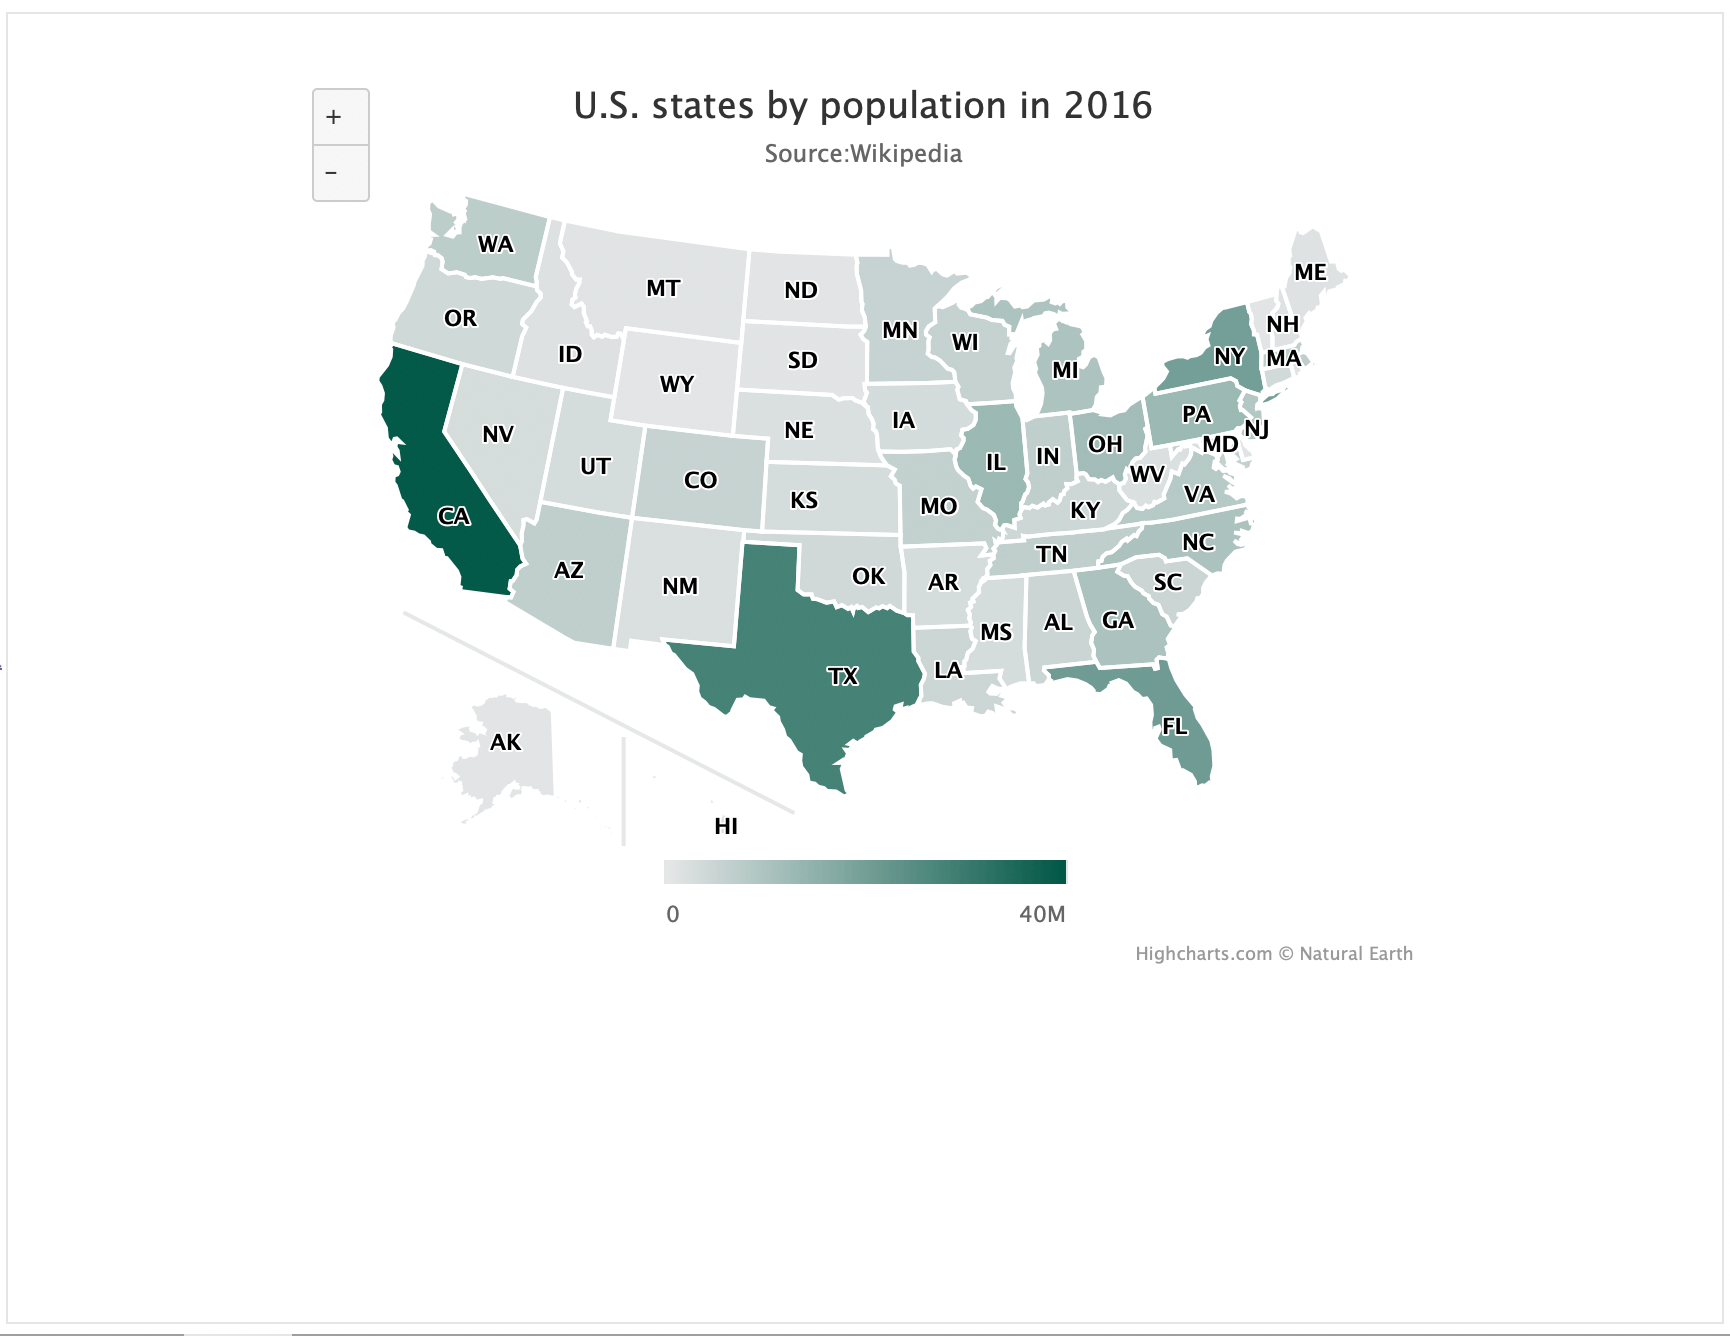
The HTML5 Map feature has been introduced to create interactive maps. It lets you display the information related to a geographical area using the HTML5 Map components. Design is done in JaspersoftStudio, but execution can be done in JaspersoftStudio, JasperReportsServer and JasperReports IO.
Master-detail visualization in JasperReport Library
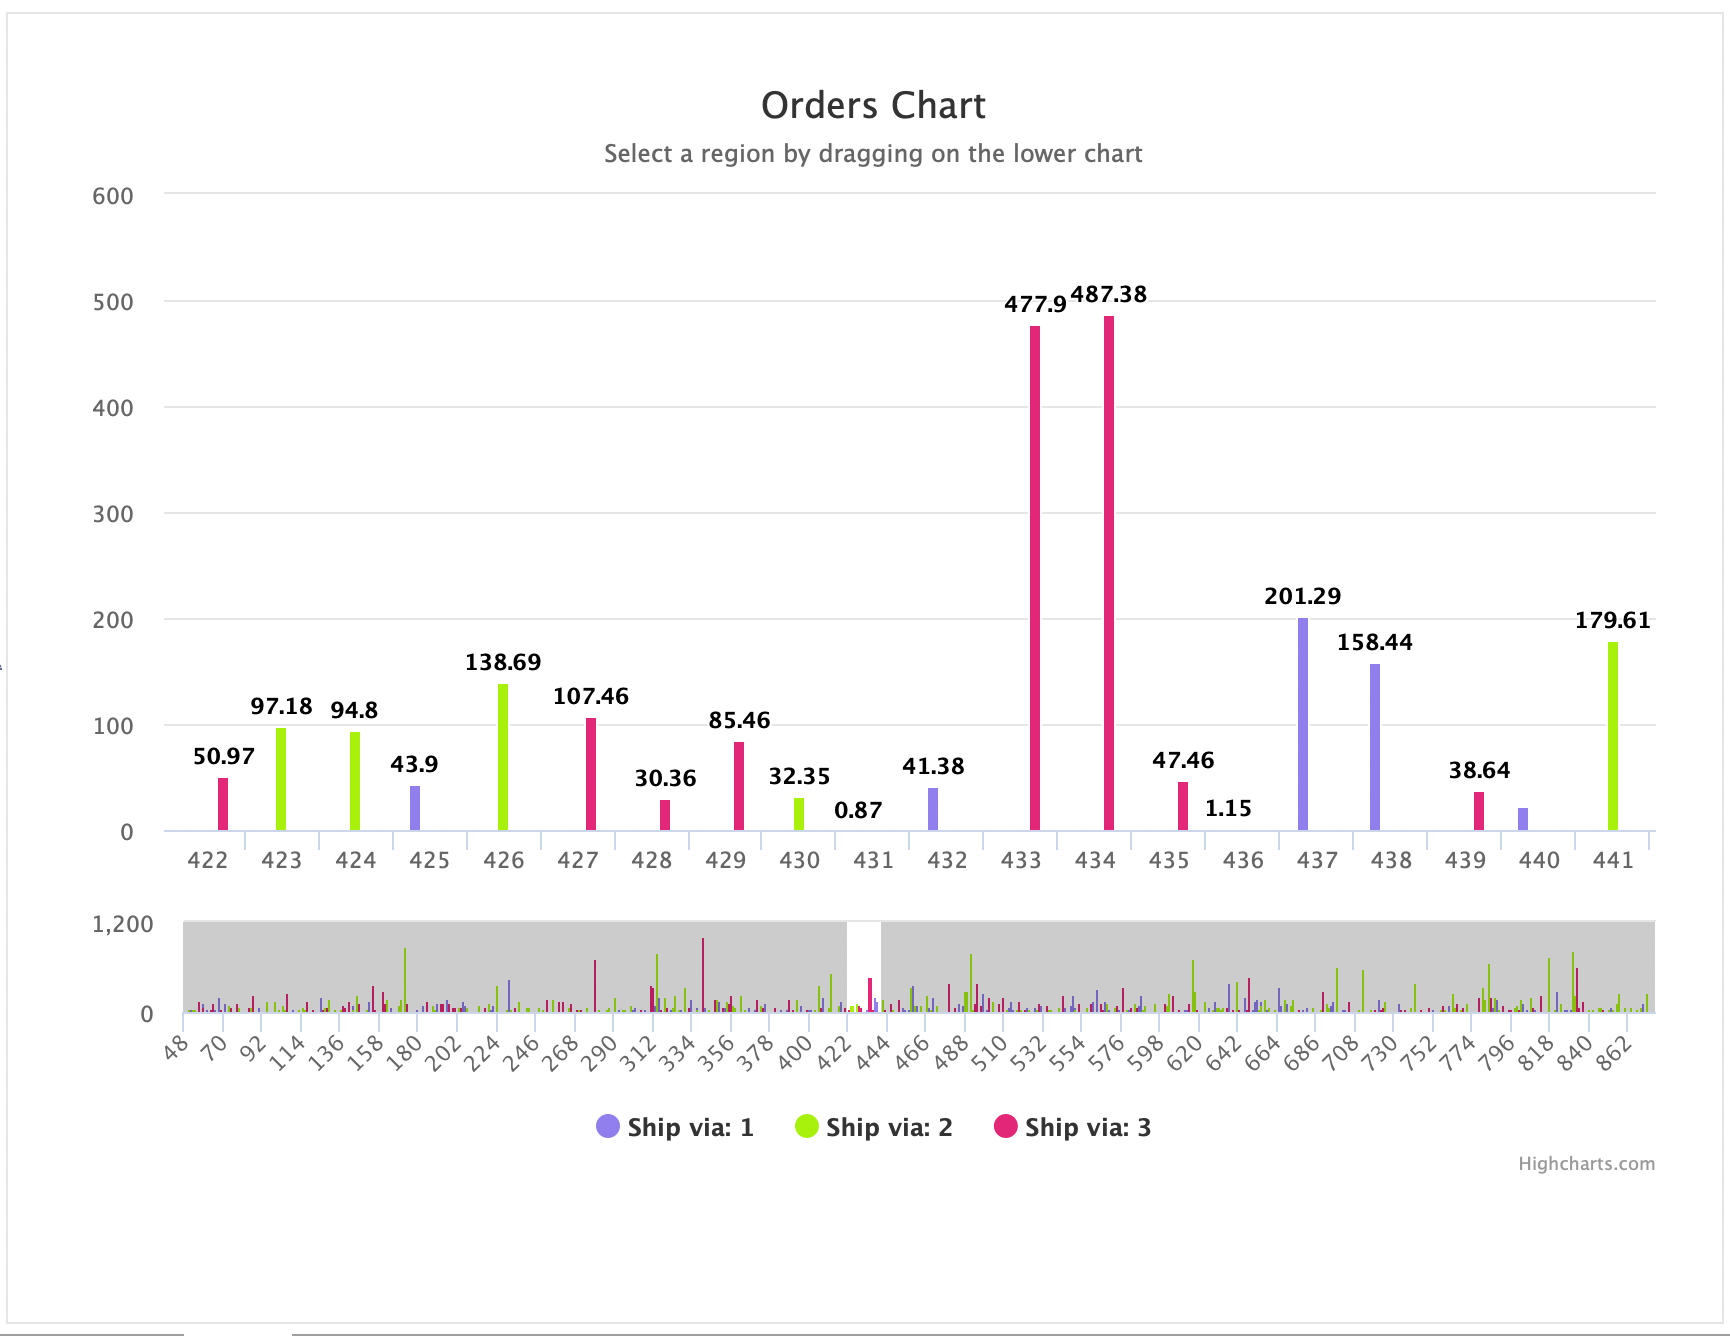
Master-detail chart is added to HTML5 chart. A master-detail chart is a high stock-like chart that has two interactive charts, a Master chart, and a Detail chart. By selecting a horizontal region on the master chart, the respective selected region will be displayed on the detail chart. Design is done in JaspersoftStudio, but execution can be done in Jaspersoft Studio, JasperReports Server and JasperReports IO.
Tilemaps visualization
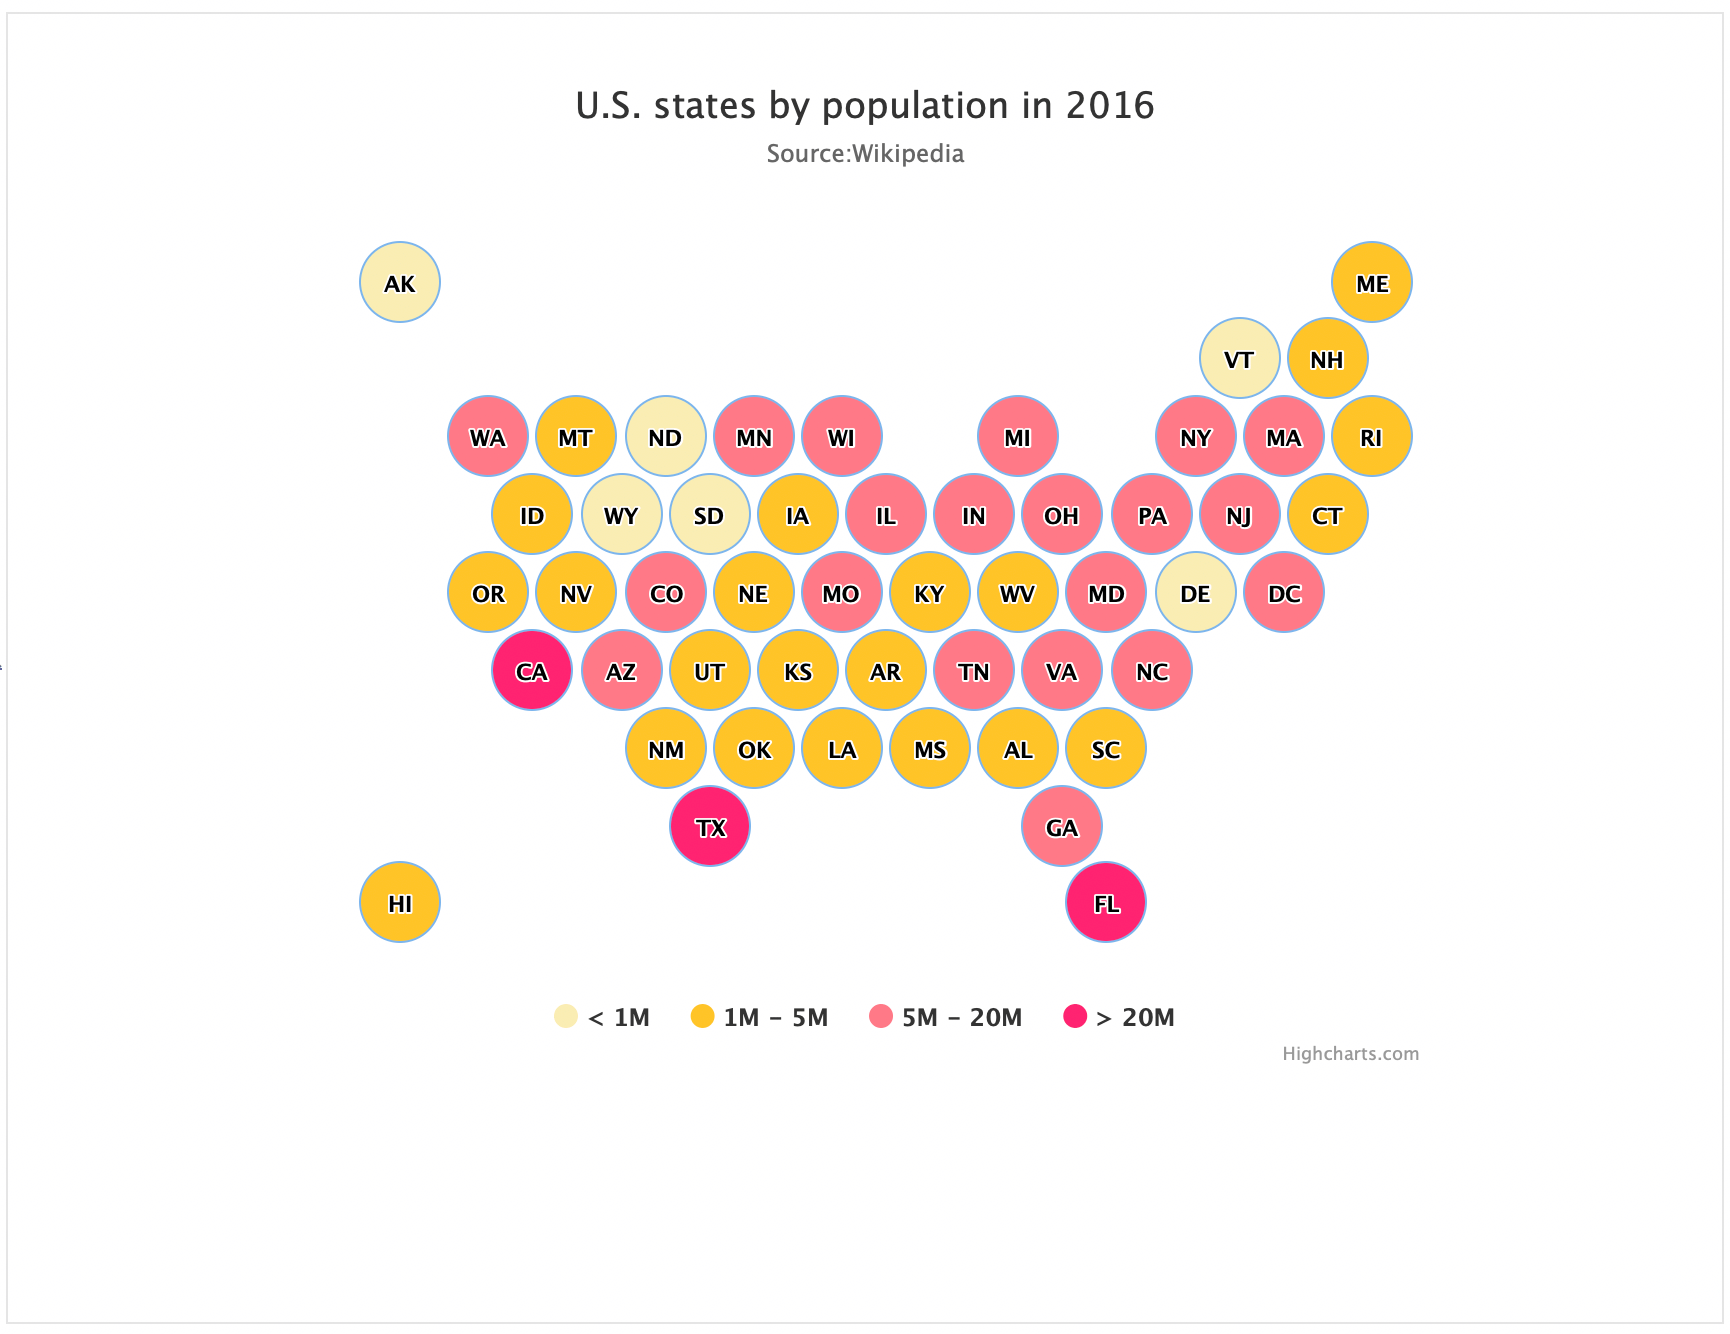
It is a new variation of Range maps under Highcharts (HTML5 charts). Design is done in Jaspersoft Studio, but execution can be done in Jaspersoft Studio, JasperReports Server and JasperReports IO.
Report Viewer Responsiveness
This feature enables the report to adapt its output to the current size of the browser window.
JasperReports IO 3.0
- Ad Hoc Reports execution in JasperReports IO
- JasperReports Server with JasperReports IO integrated is capable of executing the Ad Hoc reports (except Ad Hoc chart and Ad Hoc OLAP reports).
- JasperReports IO now supports JasperReports Server user hierarchical attributes
- JasperReports IO now supports report units that use custom code packaged into jars
Platform Support and Other Updates
Jaspersoft Studio Platform Updates
- BigSur Support
- Eclipse Upgrade to 4.21
- Groovy upgrade to version 3.0
- Java 11 Support for Studio and JasperReports IO
Application Server and Operating System Updates
- RedHat Enterprise Linux (RHEL) 8.2
- MacOS X 11x
- Debian Linux 10
- Oracle WebLogic 14.1
- Tomcat 8.5.x and 9.0.x (all 3rd digits supported)
New Connectors and Database Updates
- Snowflake - new
- Athena - new
- PostgreSQL 12 - updated
Docker Updates
- JasperReports Server now supports deployment on Docker and Kubernetes. For more information, refer to the Jaspersoft Docker Repository at https://github.com/Jaspersoft/js-docker
Security Updates
- Update of various 3rd party library versions with reported CVE's
- Tomcat Security update
For the complete list of new and updated Connectors and Platforms, please refer to this support page.
JasperReports IO 2.0 (11/2020)
Elastically scalable with no limit on clustering and thread concurrency
JasperReports IO Professional
- JasperReports IO Professional 2.0.0 comes with 10 Concurrent Report Runs and Jaspersoft Studio 7.9.0.
- JasperReports IO Professional 2.0.0 can connect to JasperReports Server repository.
- There are performance improvements and upgraded connectors and dependencies.
JasperReports IO At-Scale
- JasperReports IO At-Scale is a new flagship product that allows you to scale the JRIO service deployment in various ways, ranging from monolithic web application, with all its specialized sub-services placed together in the same application (good for testing and small scale deployments), to container-based deployments in the Cloud, where specialized sub-services run in separate containers and are able to scale independently while working together to deliver a single embeddable reporting service (suited for large scale deployments).
- JasperReports IO At-Scale also has an option for configuring JasperReports Server to be able to deploy a cluster of instances as a reporting engine.
- You can deploy a cluster using Kubernetes (AWS, OpenShift, etc.) to scale up to thousands and millions of reports per hour and thousands of pages per report.
Jaspersoft 7.9 (11/2020)
JasperReports Server 7.9
UI Improvements
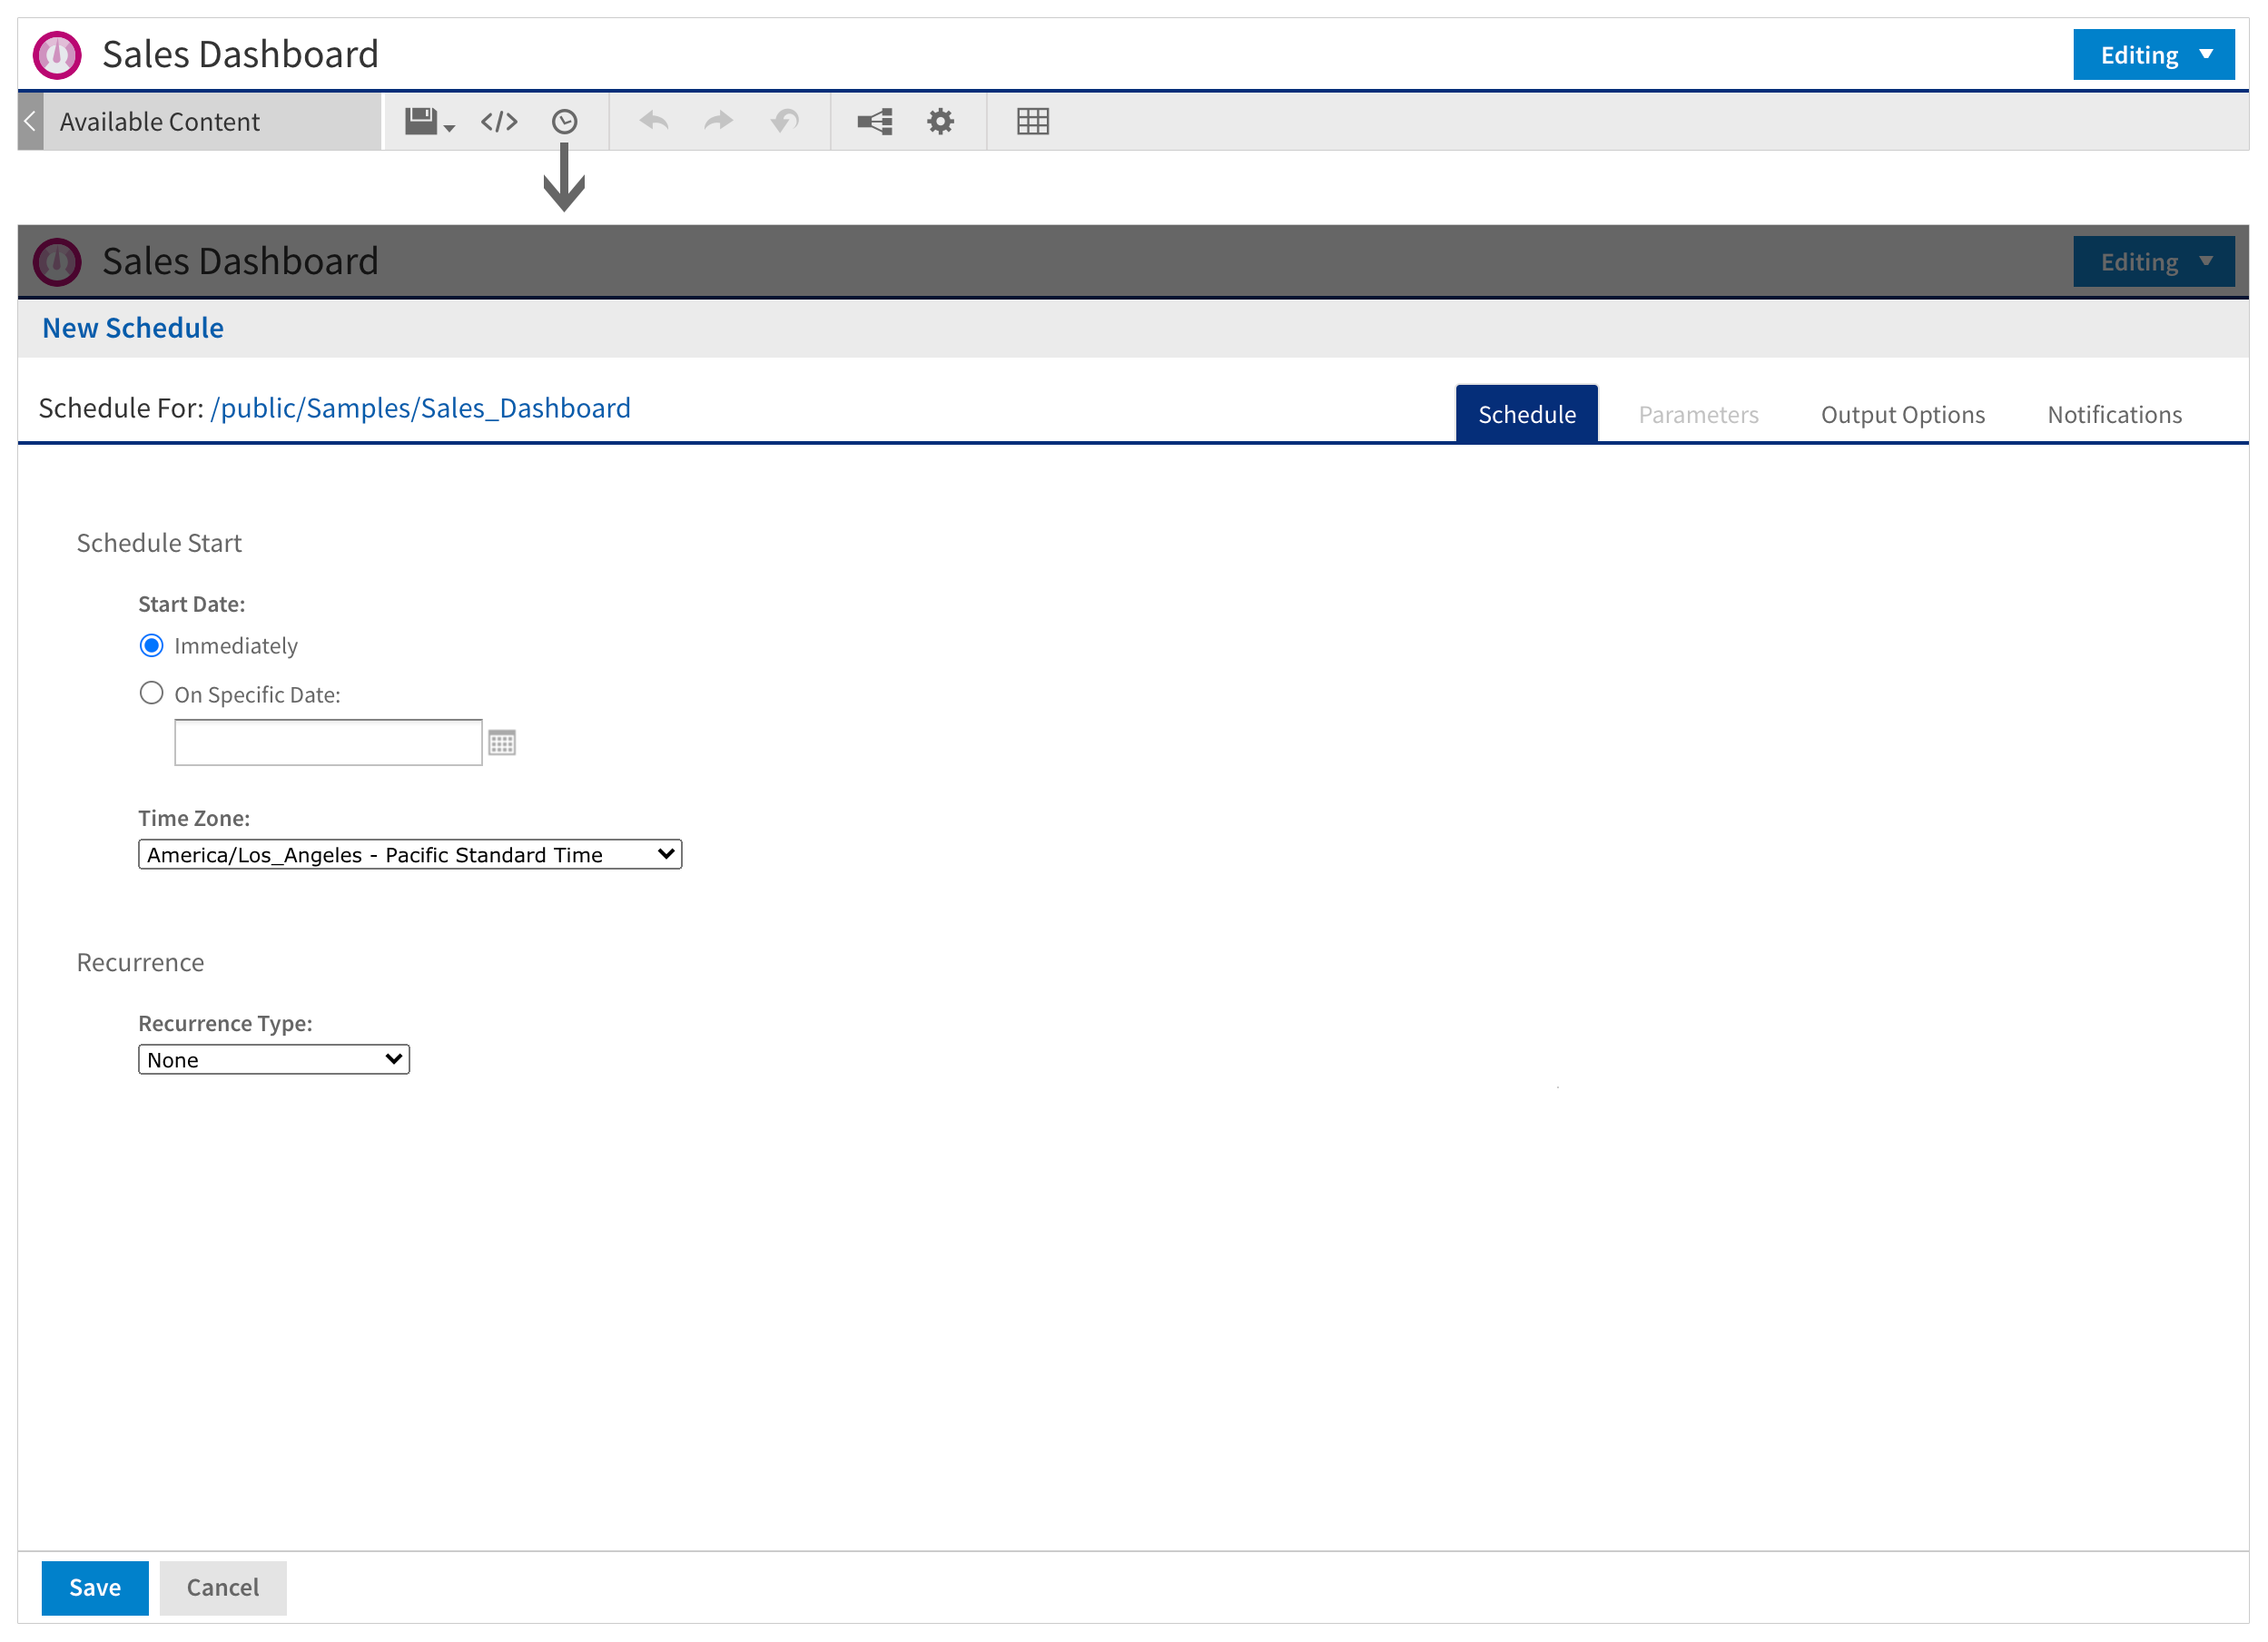
Improved Scheduler Workflow
- Users can schedule a report directly from the Report Viewer.
- Users can schedule a dashboard from within Dashboard Designer and Dashboard Viewer.
- Report Viewer is based on a new rendering
Visualize.js Updates
Accelerated experience for Visualize.js developer
With JasperReports Server 7.9.0, users can view the visualize.js code snippet for any visualization added in the Report Viewer, Ad Hoc Designer and Dashboard Designer/Viewer. This allows the user to accelerate the embedding experience using Visualize.js.
Jaspersoft Studio Updates
Parameterize the exported file name
New custom report property has been introduced to specify a prefix to use in the name of temporary files produced when exporting the report from the Report Preview tab.
JasperReports Library Updates
- Allows generic element HTML export handlers to export generic elements as images or any other built-in element type.
- New custom property to control the HTML exporting of custom visualization components as images.
Platform Updates
Database Servers:
- TIBCO Data Virtualization 8.3.0
- ElasticSearch 7.9
- Vertica 10
New Connectors & Platforms:
For the complete list of new and updated Connectors and Platforms, please refer to this support page.
JasperReports IO Integration
JRIO At-Scale can be used as a scalable reporting engine for JasperReports Server. It is able to handle peak load of concurrent executions and optimize operational expenses by scaling up when there is a demand for it and scaling down when it's not needed. It can be used for different execution types—scheduled report executions or with online executions (embedded or report executions done via JRS UI).
Jaspersoft 7.8 (08/2020)
New Domain Designer Security tab
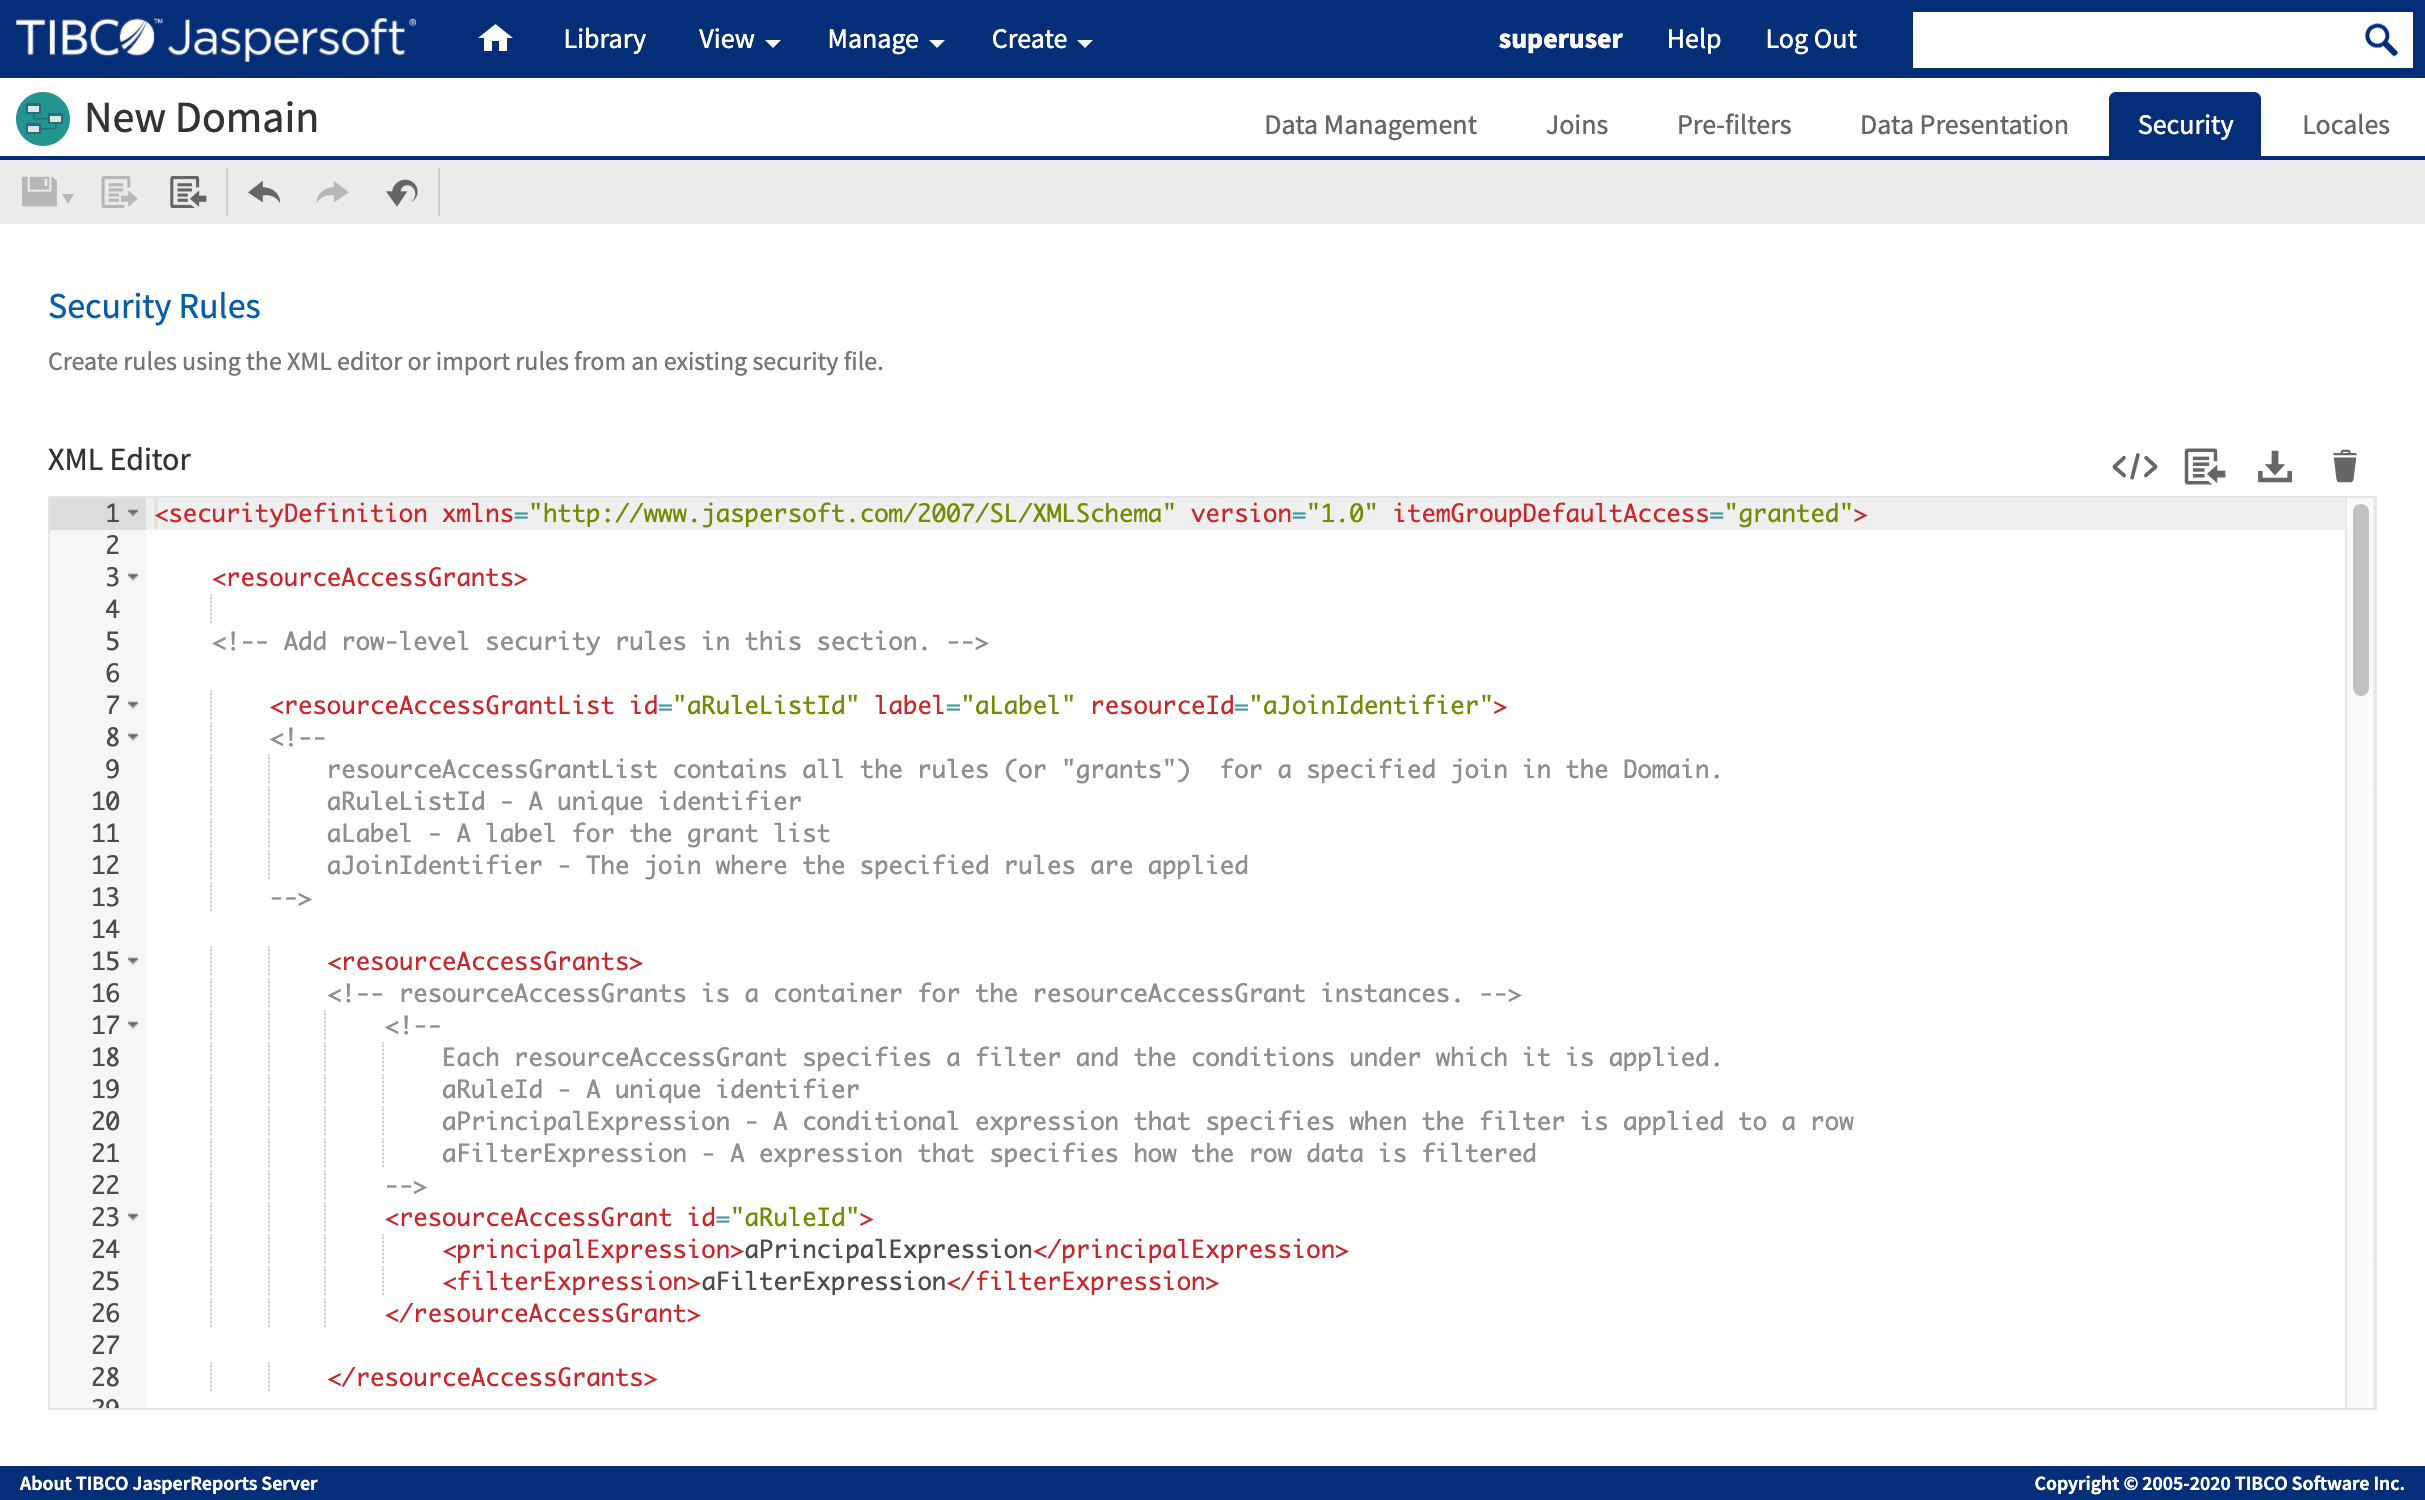
The Domain Designer has a new Security tab where one can enter and view rules that restrict access to the data in a Domain, based on a user's roles and attributes. Rules are stored in an XML file that works together with the Domain's XML design file to identify what data you want to expose to each user.
Updated user interface
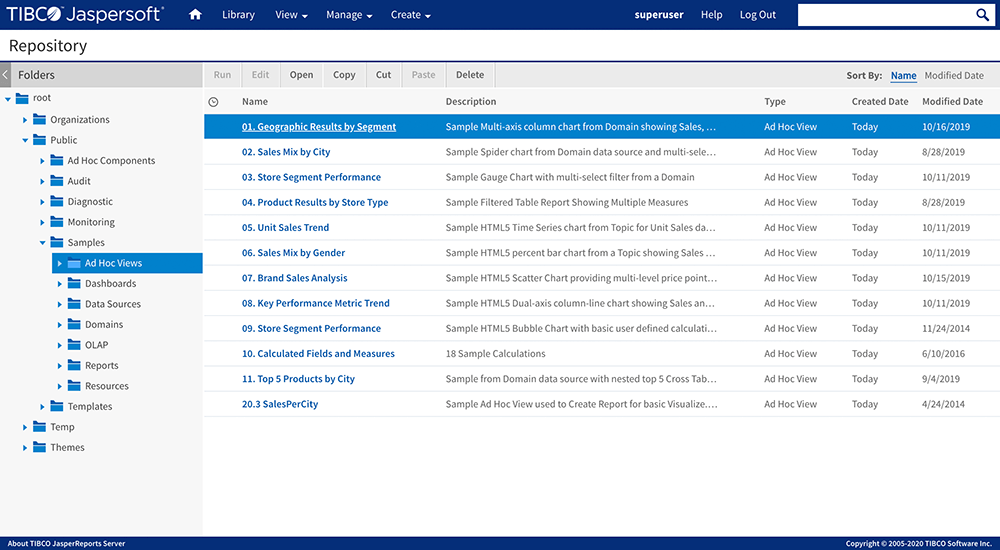
This release includes an updated look and feel for Repository, Schedule, and Management pages. Ad-Hoc designer has an improved chart-building experience, and Dashboards contain some new navigation and dashlet options.
New jasperQL query language
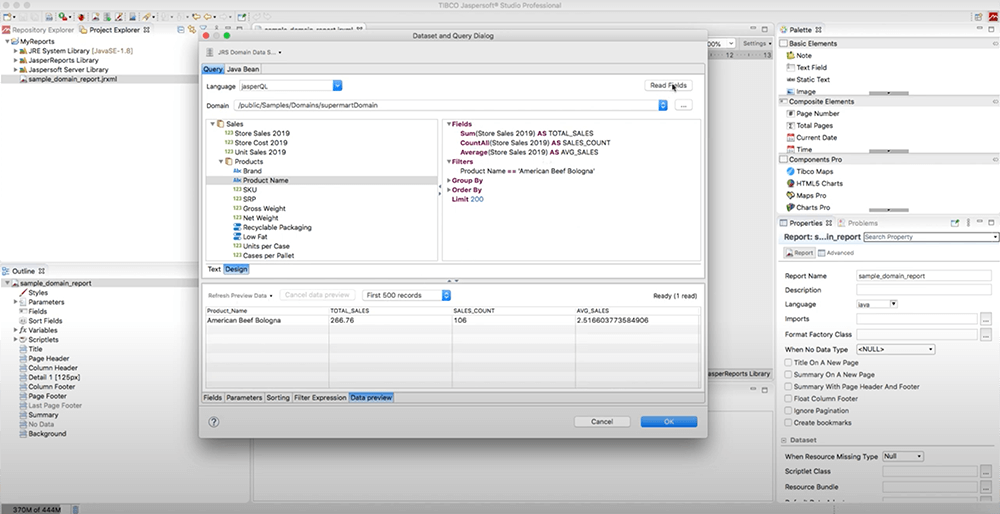
JasperQL language is a new language introduced in this release to extract data from the Jasper Reports Server and use it in the Reports at JasperSoft Studio. This language is more powerful than the domain language.
Cryptography improvements
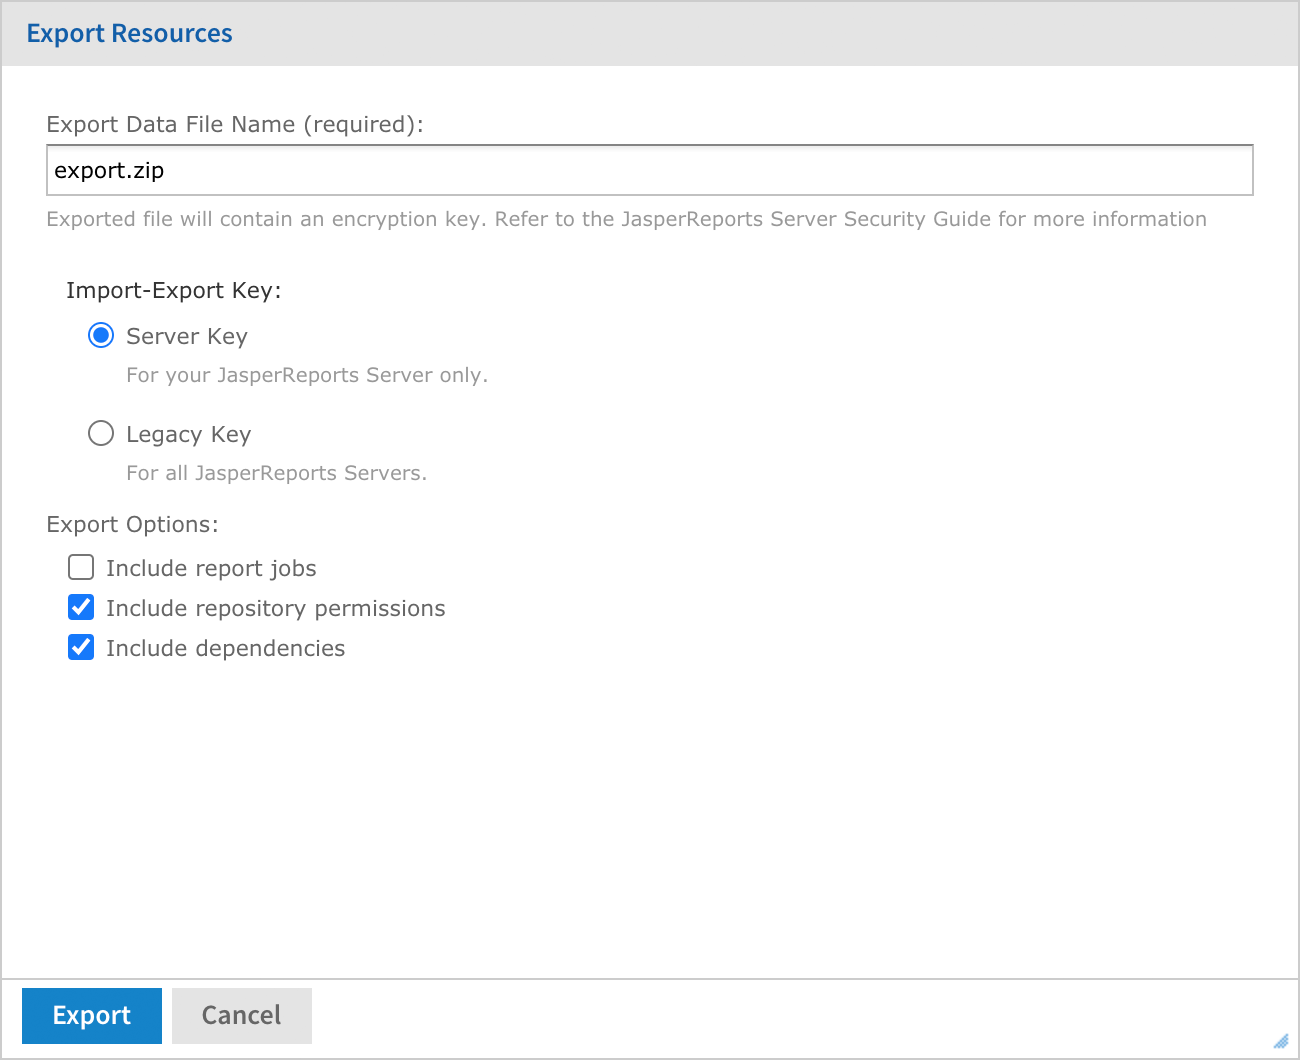
Import and export operations now allows the administrator to specify the encryption key.
Platform Updates
- New Chromium JavaScript engine: JasperReports Server Version 7.8 uses the Chromium JavaScript engine to generate graphical reports.
- New Connectors & Platforms: Google BigQuery, ElasticSearch, Neo4j, RHEL 7.8/8.
- Cloud Updates
- AWS GovCloud Certification
- Amazon Linux2 Certification
- Certified RDS Support
- Azure Marketplace Offering
For the complete list of new and updated Connectors and Platforms, please refer to this support page.
Japersoft Studio and JasperReports Library Highlights
- Secure Report execution infrastructure
- Support for PDF forms into the core library using custom properties
- Support for dynamic bookmark levels based on expressions
- Solved problem with the virtualization of large unpaginated reports containing large frame elements
These are just the highlights. For more details on updates, please refer to the Release Notes.
Visualize.js updates
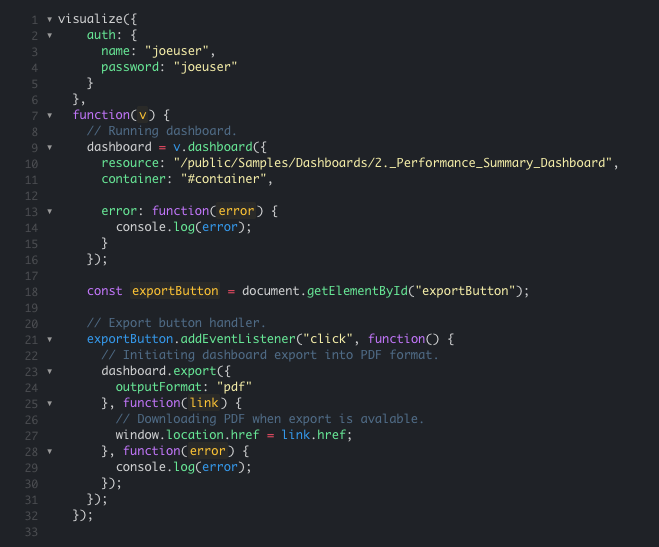
Dashboard export support has been added to Visualize.js. Supported formats include .PDF, .PNG, .DOCX, .PPTX, and .ODT.
Performance
- Filters Performance: Input Controls pagination has been added to the Report Viewer which significantly improves performance on a large list of values in single select and multi select Input Controls.
- Overall Jaspersoft Performance: JasperReports Server version 7.8 performed way better across the board during the internal Performance Benchmarking tests due to several features added to improve the design and run-time performance.
Jaspersoft 7.5 (12/2019)
Updated user interface
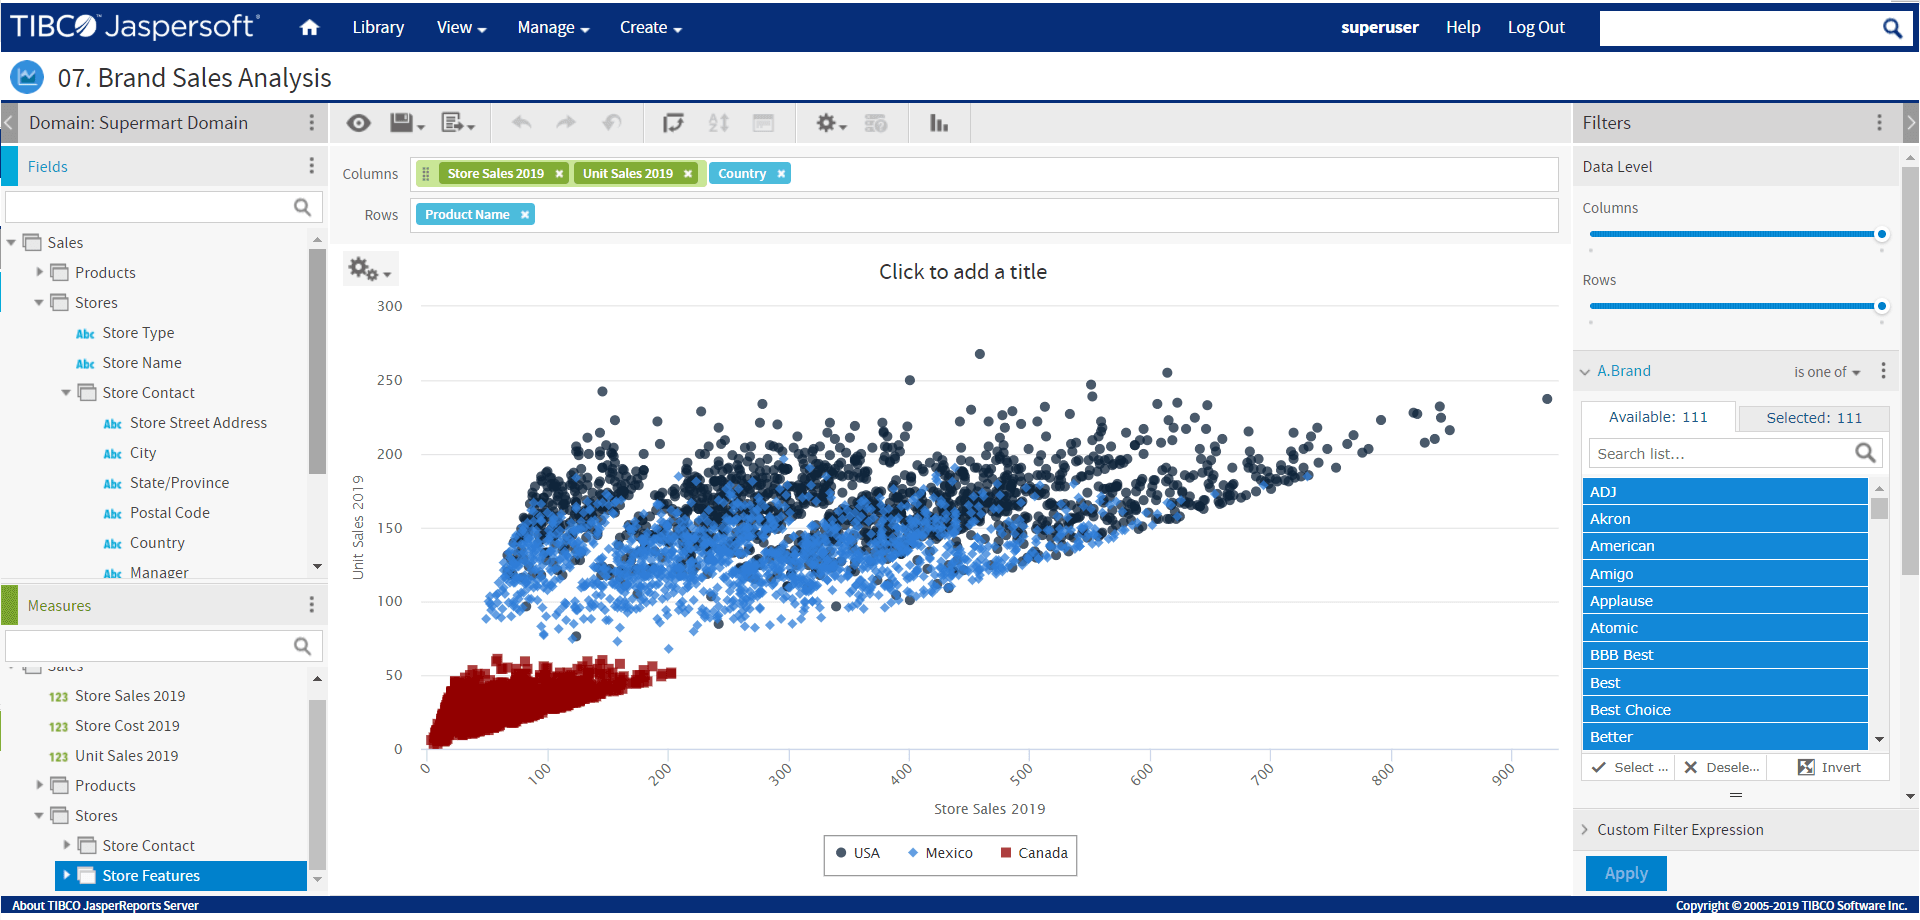
This release includes a new look and feel that is crisp and easy to navigate. It keeps the familiar layout and provides updated icons, styling, and colors throughout the application.
Three new visualizations
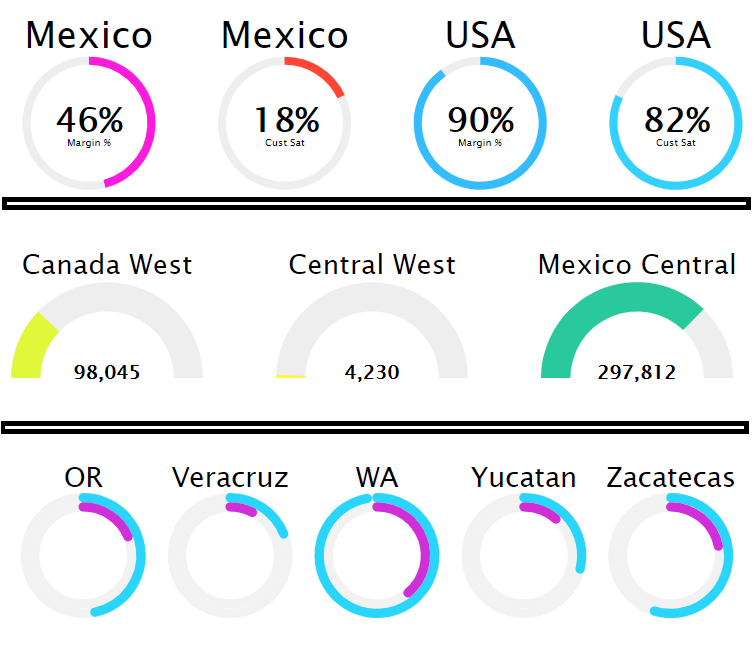
The new gauge types are the circular gauge, the multi-level gauge, and the arc gauge. These gauges have formatting properties to set minimum and maximum values, colors for value ranges, whether the value is displayed, and if so the number of decimal places and a suffix string such as the % sign.
Ad Hoc visualization selector
This UI element has been updated to choose or switch between visualizations more easily. The visualization selector now lets you choose crosstab or table, and the chart selection includes a sidebar for chart categories. In addition, the visualization mode toolbar drop-list is replaced with a visualization selector button.
New color picker dialog
The Ad Hoc Designer and Dashboard Designer have a new color picker interface for specifying colors to match any palette where visualizations are embedded. The default color selections are expanded, and custom colors may be specified precisely with HEX or RGB entry options.
Colors in Ad Hoc charts
There are several new features in the Ad Hoc Designer that allow greater customization of chart colors. New UI properties allow the user to set the series color, the plot color, and the background color in charts that allow it.
Distinct values in Ad Hoc tables
Tables often contain columns that have duplicate values in many rows, making it difficult to find relevant data. The new distinct values selector in the Ad Hoc Designer hides the duplicate rows and makes tables shorter and easier to read. Note that tables with a totals row will not recalculate the total values when duplicate rows are hidden.
Referential Integrity for Domains
New configuration settings let you adjust how strictly Ad Hoc views and reports are checked against their underlying Domain. By default, fields and measures in a view or report that do not exist in the Domain will cause an error upon opening. Administrators can adjust the level of referential integrity to allow opening views and reports when Domain security causes missing items.
Security
This release of JasperReports Server updates its use of cryptographic keys, for example to encrypt user passwords internally. All keys are now generated and managed in a single keystore for consistency. Keys used for encrypting export catalogs from older versions of the server have new procedures and user interface for importing into this version of the server. For more details, see the JasperReports Server Security Guide.
Update to Log4j 2
The logging service now relies on the updated Apache Log4j 2. This upgrade provides higher performance of the loggers and thus less overhead for JasperReports Server. If you have custom loggers, you will need to update their definitions using the new syntax.
Java 11
JasperReports Server runs with Java 8 and Java 11 for certain platforms, see the Platform Support document for more details.
Jaspersoft 7.2 (05/2019)
- New Domain Designer UX and UI
- New Domain Designer UI Performance lmprovements
- New Domain Designer Complex Joins Support
- New Domain Designer Extended Character Support
- Improved 508c for Report Viewer
- Highcharts 6.x
- Improved PPT Report Export (Dynamic Page #s)
- Over 160 quality improvements
JasperReports IO 1.0 (10/2018)
- New RESTful Reporting Engine (Limit 2 Concurrent Report Runs)
- New product: JasperReports IO Pro 1.0
- Jaspersoft Studio 7.2
JasperReports 7.1 (05/2018)
- Embeddable Ad hoc Views
- Ad Hoc Data Source Change Improvements
- Ad Hoc Time Balance Calculations
- Ad Hoc Day of Week Support
- JSS - Improved Domains Support
- TIBCO Data Virtualization Support
- TIBCO Spotfire Information Link Support
- Java8
- More than 300 quality improvements