



Analytics dashboard examples: What AI means for the future of reporting
Dashboards used to be simple. Load a chart, take a look, and jot down what you’ve learned.
AI is changing the game. Instead of static grids of numbers, dashboards can now create plain-language summaries, flag anomalies, and respond to follow-up questions before anyone even knows there's an issue. For those who depend on them, this shift transforms what an analytics dashboard looks like in 2026 and beyond, from a snapshot of the past to an ongoing conversation about what’s happening now and what to do next.

Modern analytics dashboards are evolving. Real-time dashboard examples and the "build versus buy" aspect of adding AI to reporting can make a governed, API-first approach invaluable to enterprises seeking automated decision support.
Beyond visuals: The evolution of modern analytics dashboard examples
For the past decade, a strong dashboard meant a clean layout. Think well-chosen charts, sensible filters, maybe a drill-down or two. In this traditional model, the user still had to read the data.
Natural language generation (NLG) is now removing that step. Instead of a bar chart by itself, users now see a short narrative next to it, like, "Regional sales rose 12% week over week, driven primarily by the Northeast." This shift matters significantly for accessibility, since not every stakeholder is fluent in interpreting a stacked bar chart or scatter plot. A generated summary can give them the same starting point as an analyst.
Automating insight discovery with anomaly detection and predictive trends
In the old analytics model, users did all the heavy lifting. They had to spot when a metric went off track, then dig through filters to figure out what happened.
Now, AI-powered anomaly detection is changing the game. It constantly scans incoming data, flags anything outside expected ranges, and highlights trends before they fully emerge. For product managers, that means less time combing through dashboards for issues and more time acting on alerts that already suggest likely causes, like a sudden drop in conversions, a latency spike, or a shift in churn risk. Development teams benefit too, since they can skip watching countless panels and instead focus on the issues the system escalates.
Natural language interfaces: Moving from static charts to conversational data
The most visible shift in dashboards is how users ask questions about their data. Natural language querying now lets people type, "What were our top three underperforming regions last quarter?" and receive a direct answer, without filing a request with a data team or writing SQL. Actian's AI Analyst is built for exactly this: a conversational analytics tool anchored to a governed semantic layer, so the answer reflects the same metric definitions a formal report would use, not an ad hoc read of the raw tables.
Natural language querying has a real effect on internal workflows. In the past, business leaders had to wait for analytics or engineering teams to build a custom report, but now they can self-serve on demand. This doesn't eliminate the need for skilled data teams, though; it just changes what they spend their time on. Instead of being swamped by one-off requests, they can focus on maintaining the governed data models that enable accurate natural language answers.
Strategic AI integration for embedded reporting environments
For companies embedding analytics into their own products, the natural language layer raises a familiar question: should we build our own embedded reporting software, or buy a ready-made one?
While developing anomaly detection, prediction modeling, and natural language generation in-house is possible and technically gives you more flexibility, it requires sustained financial and energy investment in data science and model maintenance. Plus, you have to maintain the reporting infrastructure itself.
Buying a ready-made option comes with its own constraints, though. Power BI Embedded, for example, requires an Azure Active Directory tenant and ties licensing to Microsoft's capacity-based pricing model. For a company already running on Azure, that integration is straightforward. For a company built on AWS, Google Cloud, or a mixed-cloud stack, it means maintaining a parallel Microsoft identity and billing relationship just to embed a reporting layer. For SaaS companies trying to keep their stack cloud-agnostic, or that serve customers with strict data-residency or vendor requirements outside the Microsoft ecosystem, this kind of lock-in can rule out an otherwise capable tool before evaluation even starts.
Fortunately, there's an energy- and money-friendly alternative to the build-versus-buy question: integrating AI-driven reporting via an established analytics platform's APIs. This way, a host application can add automated summaries, predictive alerts, and workflow triggers without taking engineering time away from the core product. This choice is a lot faster than building something from scratch. It also inherits improvements to the underlying models over time instead of requiring the host company to rebuild them.
Preparing the technical architecture for AI-powered analytics
Tech advances have also changed the technical architecture for AI-powered analytics.
Traditionally, reporting runs on a "pull" model, where a user opens a dashboard, requests data, and waits for the system to return it. However, AI-powered analytics is shifting organizations toward a "push" model, in which the system delivers relevant insights, alerts, and summaries before anyone asks.
While this is powerful, teams can only make this shift work by ensuring the layer beneath the dashboard functions. We mean the semantic layer: a governed translation layer that keeps business logic, metric definitions, and data relationships consistent. When AI generates a summary or answers a natural language query, the answer reflects governed, consistent definitions rather than an ad hoc interpretation of raw tables every time. Without this semantic layer, AI-generated reporting may produce answers that look confident, but don't actually align with how the business defines its own metrics.
AI Analyst runs on this same layer, so a report and a typed question return the same numbers.
The semantic layer also matters for traceability, enabling users to see where a generated insight came from so they can perform accurate, reasoned analysis rather than just read the conclusion and automatically sign off on its correctness without critical thinking.
If you're interested in an API-first embedded analytics platform that enables automated, consistent decision reporting, consider Jaspersoft. Together with Actian's AI Analyst, Jaspersoft provides robust dashboard reporting capabilities, pixel-perfect reporting, key performance indicator (KPI) tracking, and ad hoc reporting for comprehensive business intelligence, plus a conversational layer that answers in plain language while staying within the governed semantic model behind.
Ready to give it a spin?
Start your 30-day trial now.

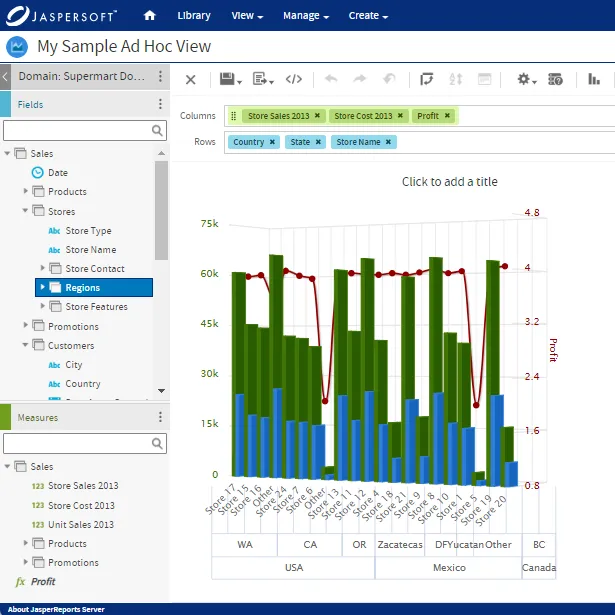
Try Jaspersoft - Free Trial
Efficiently design, embed, and distribute reports and dashboards at scale with Jaspersoft.
Build versus Buy: An In-depth Guide
This whitepaper provides a framework for the decision-making process and critical trade-offs between building or buying an embedded BI and reporting tool.
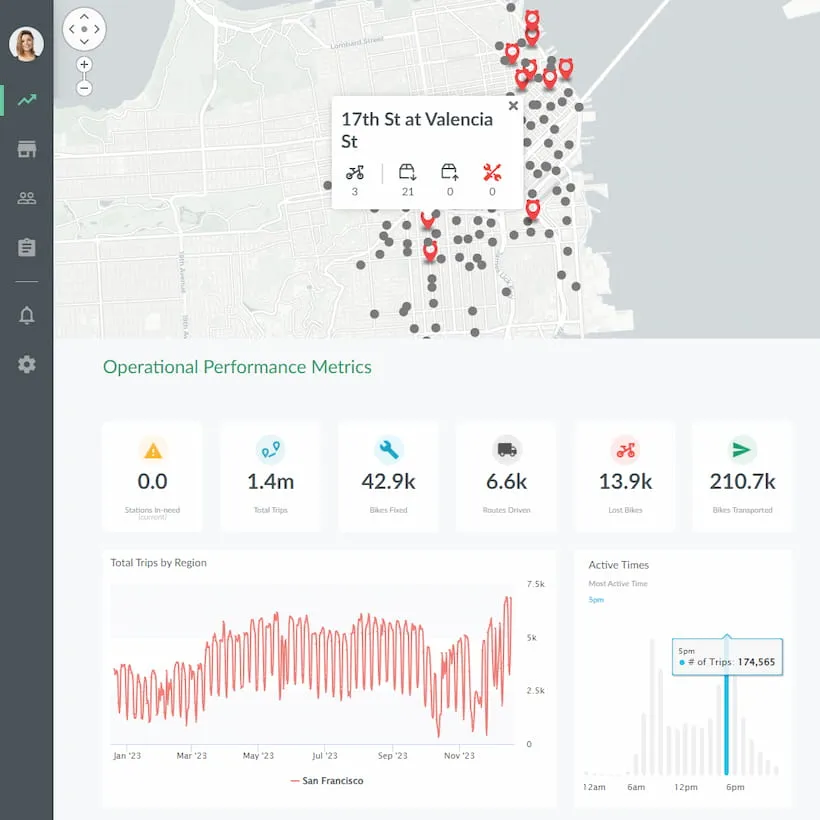
Interactive demo: Bikeshare Embedded BI, supported by Jaspersoft
Experience how to turn data into valuable insights that you and your customers can use to make better decisions.
