



Bad data visualization examples
When organizations encounter problems with their BI platform's data visualization, they often focus on misleading charts or poor dashboard design, but the real problem often starts much earlier. Inconsistent, poorly governed data is the source of many data visualization failures, and when these issues are resolved, data storytelling not only becomes much more compelling, but the insights locked in your data rise to the surface to emerge sooner and with greater clarity.

This article on bad data visualization examples with data will explore how inconsistent definitions, siloed data, missing metadata, weak governance, and poor data quality lead to inaccurate reports and dashboards, regardless of which BI platform you use. We'll also show the link between reliable reporting and the broader data lifecycle and demonstrate why accurate reporting depends on strong data management practices such as data discovery, cataloging, lineage, governance, and quality management. By strengthening these components of their data pipeline, teams can democratize trusted data access and build more accurate, scalable analytics across their applications.
The impact of data silos on reporting consistency
Siloed data is a leading cause of many misleading data visualization examples. Disparate data sources can damage reporting consistency, leading to conflicting KPIs and discrepancies in the results of your analytics. Without a unified, single source of truth to draw from, many data visualization tools end up conveying inaccurate findings, leading to incorrect business decisions.
A lack of synchronization on the backend can also impact reporting consistency. It can lead to severe data latency, inconsistent cross-table metrics, and high database CPU load, and can cause users to see mismatched numbers across widgets and embedded reports.
To resolve the silo component of synchronization-related issues, organizations can store all their data into a comprehensive data warehouse or lake accessible to all departments, with all access requests and permissions being governed by the appropriate access control measures. To resolve the backend component, use Change Data Capture (CDC) tools to capture database modifications instantly, then stream these changes to update your reporting database in near-real-time. This helps your systems to stay current and to draw all data from the same pool, reducing any discrepancies in your data visualizations.
Inconsistent business definitions as a source of visual error
Just as inconsistent data sources lead to bad data visualization examples, inconsistent definitions of business terms across departments can also create confusion. Teams frequently define certain metrics or KPIs according to their own unique processes, leading to miscommunications and faulty analytics inferences for teams outside their departments. Some common examples of business metrics and KPIs that differ across departments are:
- Customer lifetime value is defined in Finance as the total net profit a customer brings after subtracting all costs to serve them, while in marketing it's defined as the total revenue a customer spends before subtracting service and product costs.
- Employee turnover is defined by HR as the total number of people who leave the entire company in one year, while management defines it as: the total number of people who leave a specific office or team or office.
- Customer churn rate is defined by customer success teams as the percentage of account logos or individual clients who cancel their subscriptions, while product teams define it as the percentage of users who stop logging into the software or app for 30 consecutive days, even if their contract is still active.
When teams construct data visualization tools according to their own business definitions, teams from others departments may extract a meaning that the tool was never meant to convey. To avoid this confusion, adopt a uniform definition for all metrics and KPIs, and enforce it throughout all your reports.
Technical failures in the data lifecycle that break visualizations
Bad data visualization can distort facts, mislead decision-makers, and waste time — and poor context is often the cause. For example, lack of context in data catalogs makes it difficult to understand spline charts, and can cause users to make inferences based on stale, inaccurate, or irrelevant data. These unchecked errors can result in dashboard design mistakes that then propagate into final user-facing dashboards, leading users to faulty conclusions and costing organizations their public trust.
To better contextualize the data in your catalogs, consider taking these steps:
- Track data lineage by showing where data comes from and how it changes.
- Highlight any data changes or errors upstream that could impact a chart.
- Define ownership and quality by showing automated data quality and freshness scores.
- Flag deprecated or old tables to prevent the use of bad data.
By tracking ownership and lineage, maximizing integrity and quality, and highlighting all meaningful data changes, teams can create the proper context around their data, eliminating many of the errors that cause poor data visualization.
Building a trusted foundation for scalable embedded analytics
Accessible data discovery and proper data governance are prerequisites for scalable, embedded, self-service analytics. Simplified data discovery makes it easy for authorized team members to perform ad hoc data analysis and gain reporting insights as needed, and data governance ensures both that the data available is of the highest possible quality, and that the user accessing it is allowed to do so. A few steps to take as you build out your infrastructure for scalable embedded analytics are:
- Centralize metadata so users find and understand available datasets quickly.
- Use machine learning to classify data types and sensitive fields.
- Set role-based and attribute-based permissions to protect private data.
- Monitor data for errors, missing values, and schema changes.
We've written in greater detail on data governance in analytics in our data-centric product management guide, but starting with these steps, teams can begin to build out a foundation for a scalable embedded analytics solution that's free from architecturally-rooted data visualization errors.
Moving beyond aesthetic fixes to structural data integrity
While design-oriented steps such as correcting misleading scales and aligning time periods can improve the clarity of your data visualization tools, some issues require a more architectural fix. Integrating data from sources across all business silos can yield more accurate analytics results, and maintaining consistent business definitions for all metrics and KPIs can remove miscommunication and lead to more accurate business decisions. Because some issues stem from data discrepancies in the hardware, software, or platform layers, architecture-agnostic tools can resolve many data visualization errors by creating a more interoperable environment, providing a fix at the source.
Jaspersoft's embedded analytics and reporting solutions not only let users develop interactive visualizations intended for exploration, but also help them generate pixel-perfect reports designed for consistent, auditable communication. Our platform makes it easy to implement the data management practices needed to resolve many of the leading data visualization issues at the architectural level, providing more than a cosmetic solution to the most common data visualization failures. Contact us and learn how to move toward a cleaner, more insightful digital story and stronger data integrity.
Ready to give it a spin?
Start your 30-day trial now.

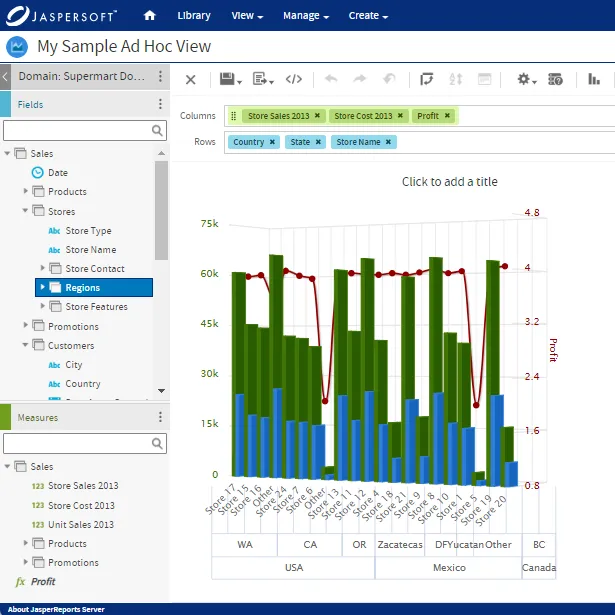
Try Jaspersoft - Free Trial
Efficiently design, embed, and distribute reports and dashboards at scale with Jaspersoft.

Build versus Buy: An In-depth Guide
This whitepaper provides a framework for the decision-making process and critical trade-offs between building or buying an embedded BI and reporting tool.
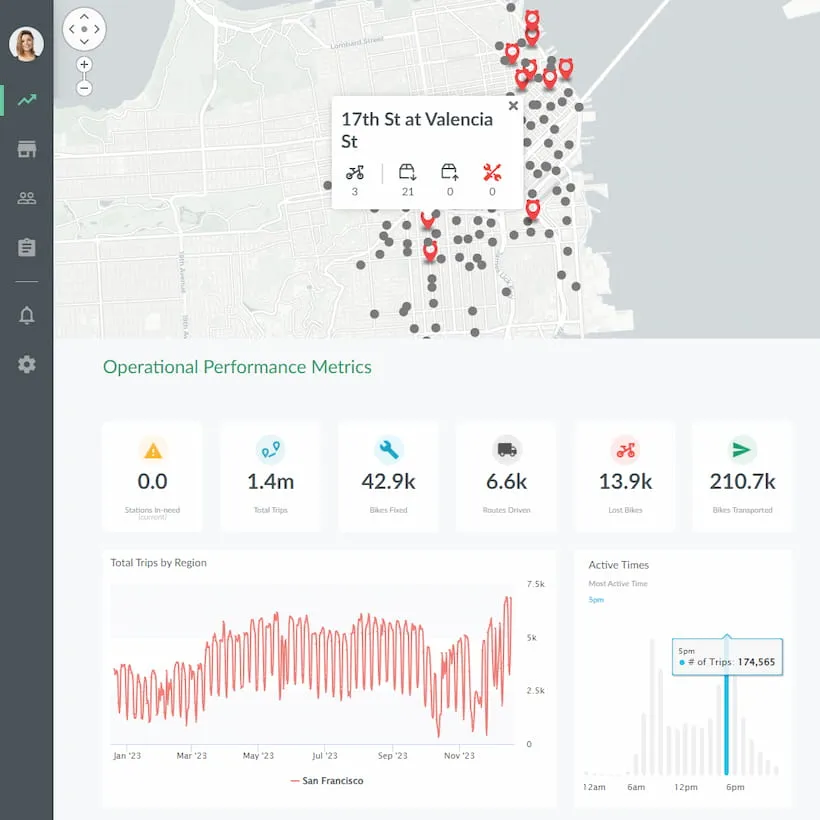
Interactive demo: Bikeshare Embedded BI, supported by Jaspersoft
Experience how to turn data into valuable insights that you and your customers can use to make better decisions.
