



Beyond basic dashboards
Data visualization tools are critical for communicating technical findings to non-technical personnel. They help executives and stakeholders make data-driven decisions, give actionable insights into complex business operations, and elevate user engagement by delivering compelling digital narratives. With so many types of data visualization available, selecting the right one is essential for conveying your findings with clarity and turning your data into a competitive edge.
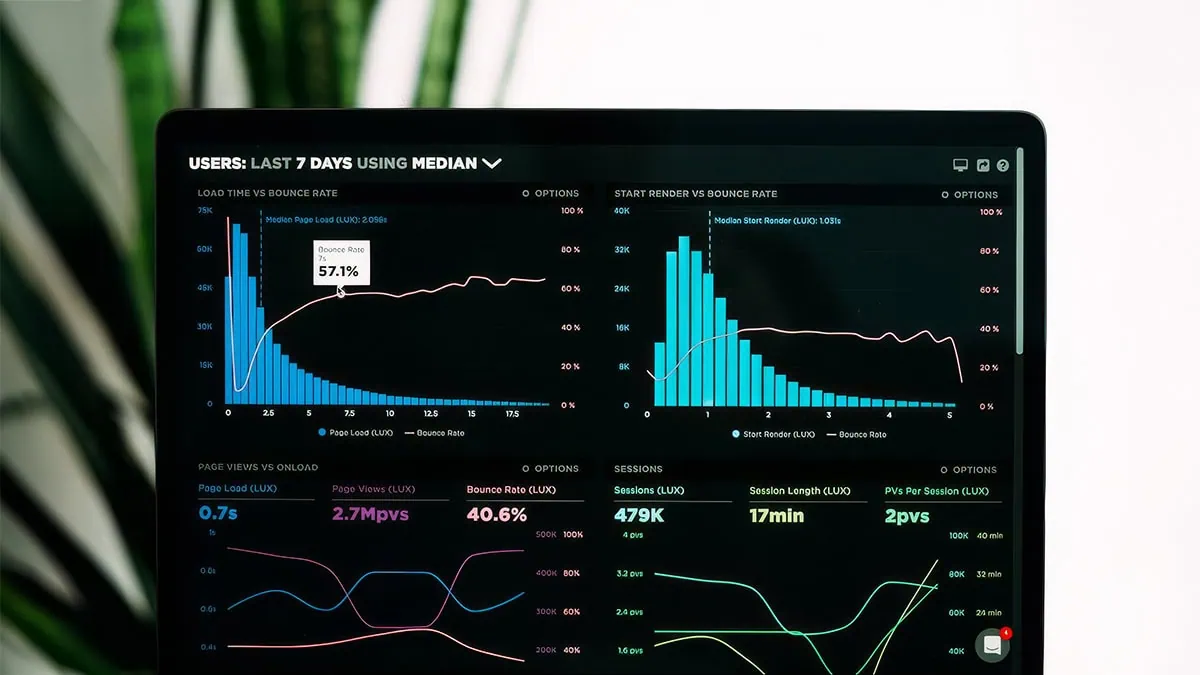
This article will define what data visualization is and provide good data visualization examples, along with their appropriate use cases. We'll look at some real-world enterprise contexts, where visualization must support embedding, governance, performance, and pixel-perfect output. Then we'll show how data visualizations work within scalable, integrated analytics environments — and how the right tool makes all the difference.
Pixel-perfect reporting for regulatory and financial compliance
Data visualization is a component of pixel-perfect reporting, which is especially important in industries that must adhere to strict compliance standards. For example, the financial sector requires numerous high-fidelity documents, and many standard web charts lack the precise layout control needed to maintain compliance across PDF documents. A few types of documents that depend on pixel-perfect precision in the financial sector are:
- Bank statements
- Invoices
- Profit and loss statements
- Balance sheets
- Cash flow statements
- Annual reports
Without customizable data visualization capabilities, a financial institution may not only fail to comply with certain regulations but also have difficulty communicating its financial status to executives and other key stakeholders. This could lead to inaccurate interpretation of financial data, which could in turn result in lost profits, missed financial opportunities, and lower customer satisfaction.
Self-service ad hoc views for product innovation
Data visualization also fosters faster, smarter innovation by comparing iterations — and it enables data-driven decisions across the whole team. While static reporting tools can be useful for deriving insights from historical data, reliance on obsolete or incomplete data can lead to suboptimal business decisions. Static, precise reporting documents often require significant technical expertise to create and format, making it difficult for non-technical personnel to query their findings or to generate reports of their own.
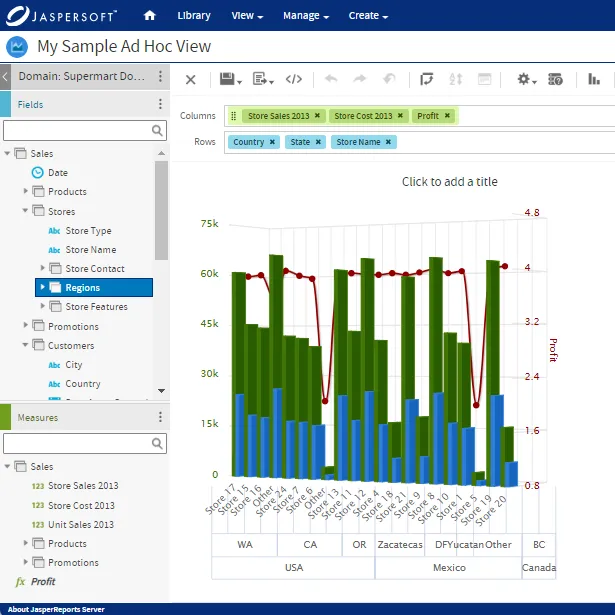
Instead of relying on these legacy solutions, today's fast-paced business world demands more dynamic reporting that lets users analyze real-time data and query the findings with self-service analytics and ad hoc reports. Dynamic data visualization tools enable end users to work with incoming data streams so they can base their decisions on the most recent available information. They also empower end users by eliminating the need for technical expertise to generate insights so every team member can drive innovation based on the actionable information they glean from the data.
Embedding dashboards in multi-tenant SaaS environments
Companies that provide Software-as-a-Service (SaaS) offerings to specialized industries and organizations must decide how to integrate data visualizations into their existing UI/UX. If they choose to buy, vs build out their SaaS data visualization strategy, product managers should look for a reporting solution that employs these technologies to maintain their brand's look and feel with features that allow:
- White-labeling. When reporting tools allow users to customize their fonts, logos, colors, and data visuals, they enable greater consistency with the rest of the brand. These tools should also let users automate their choice of colors, graphics, and fonts, so that all reports and visuals can keep a uniform appearance as needed.
- An API-first approach. By establishing API endpoints before any frontend or backend code, API-first tools offer smoother integration between disparate components in your environment. This enables easier integration and greater uniformity throughout your application, for a more seamless user experience.
- Architecture-agnostic deployment. With companies using such a wide variety of databases, platforms, and cloud providers, their reporting tools must be independent of any one technology, vendor, or platform. Architecture-agnostic deployment lets users implement their reporting solution regardless of the system they run on, enabling greater flexibility if they pivot to other systems in their environment later on.
When multi-tenant SaaS providers leverage an embedded analytics solution that offers white-labeling and pixel-perfect document generation on the front end, they give their tenants the flexibility and control needed to maintain their unique branding. When that solution combines API prioritization with backend architectural agnosticism, their tenants can integrate pixel-perfect reporting capabilities into their operations, regardless of how their ecosystems are built.
Developing a scalable strategy: The build vs. buy decision
When deciding to implement data visualizations inside an application, one key question to consider is "Build vs. Buy". Custom-built D3.js charts offer greater customization flexibility and precise control over your data layout, but their complexity often leads to longer creation times and may require a more technical skill set. Commercial reporting engines possess libraries filled with examples of good data visualization, but their "out-of-the-box" templates may lack the customization required for more complex reports. Time-to-market and maintenance costs are other factors to consider, as in-house reporting operations may take longer to build and cost more to maintain.
To overcome the drawbacks of both approaches, a pixel-perfect reporting solution should offer a wide range of high-quality data visualization examples, along with the full customization required for complex reports. For example, Jaspersoft offers a host of analysis report examples to help non-technical users generate ad hoc reports with ease. It also lets users build custom pixel-perfect reports from scratch, offering the best of both "Build" and "Buy."
Optimizing rendering performance for high-volume enterprise data
Despite their importance, several technical bottlenecks can impact the quality of data visualization tools and mar the clarity of the data they represent. For example, large datasets can be difficult to render, and pixel-perfect reports must maintain the same content and layout across a wide range of export formats and devices. Employing the right data model can help resolve these obstacles, making the modeling layer as critical as the visual layer for enterprise-grade analytics.
Using Jaspersoft, developers can embed analytics functionalities into an existing environment and empower end users to visualize insights from some of your organization’s largest datasets, within their own custom application. Our pixel-perfect document generation solution lets both technical and non-technical users create customized visuals that align with their unique business objectives. The result is improved compliance, a seamless user experience, and faster product innovation.
To see how Jaspersoft's embedded analytics features can elevate your operations, check out our embedded analytics solutions today.
Ready to give it a spin?
Start your 30-day trial now.

Try Jaspersoft - Free Trial
Efficiently design, embed, and distribute reports and dashboards at scale with Jaspersoft.
Build versus Buy: An In-depth Guide
This whitepaper provides a framework for the decision-making process and critical trade-offs between building or buying an embedded BI and reporting tool.
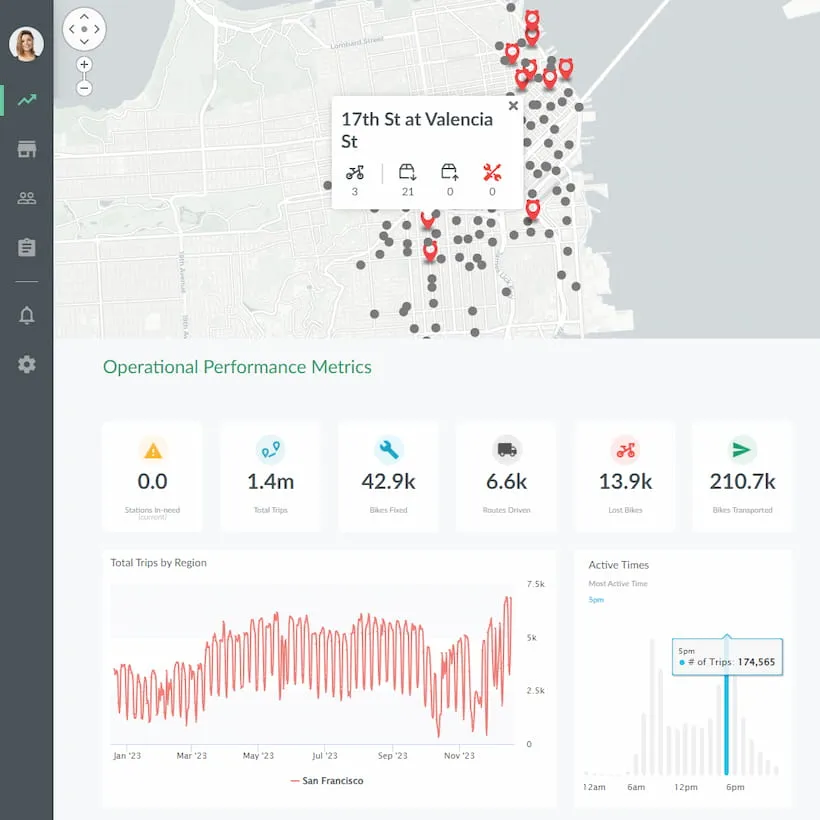
Interactive demo: Bikeshare Embedded BI, supported by Jaspersoft
Experience how to turn data into valuable insights that you and your customers can use to make better decisions.
