What are Dynamic Dashboards?
Dynamic dashboards are real-time, personalized, multi-user platforms that enable organizations to add new business intelligence content and update existing data seamlessly. Typically, these include data importing and exporting abilities, individualized dashboard views, and integration with other platforms and web technologies.

Think about a car dashboard. You need to know if the engine is functioning correctly, how fast you’re going, how much fuel you have, and which radio station is playing. In the same way, a business dashboard gives real-time results, performance indicators, and alerts the user to anything they need to take action on immediately. They are a great way to understand how the company has performed in the past and what is happening in the moment, two critical aspects for any business that wants to be successful.
Dynamic dashboards in particular have extra functionality that static dashboards do not. Imagine a car dashboard that tells you what speed you went yesterday, or what speed your neighbor drove at. Dynamic dashboards allow business owners to control data visibility without having to build separate programs or interfaces.
Modern business intelligence dashboards leverage richer content experiences through interactive elements like lightboxes, video, overlays, and slicers to encourage user engagement and help gain further insights. Some dashboards even make use of social feeds to enhance brand loyalty and deliver real-time actions.
Dashboards also utilize the value from business data. Rather than going into a black hole, this takes your business information and creates positive outcomes from it.
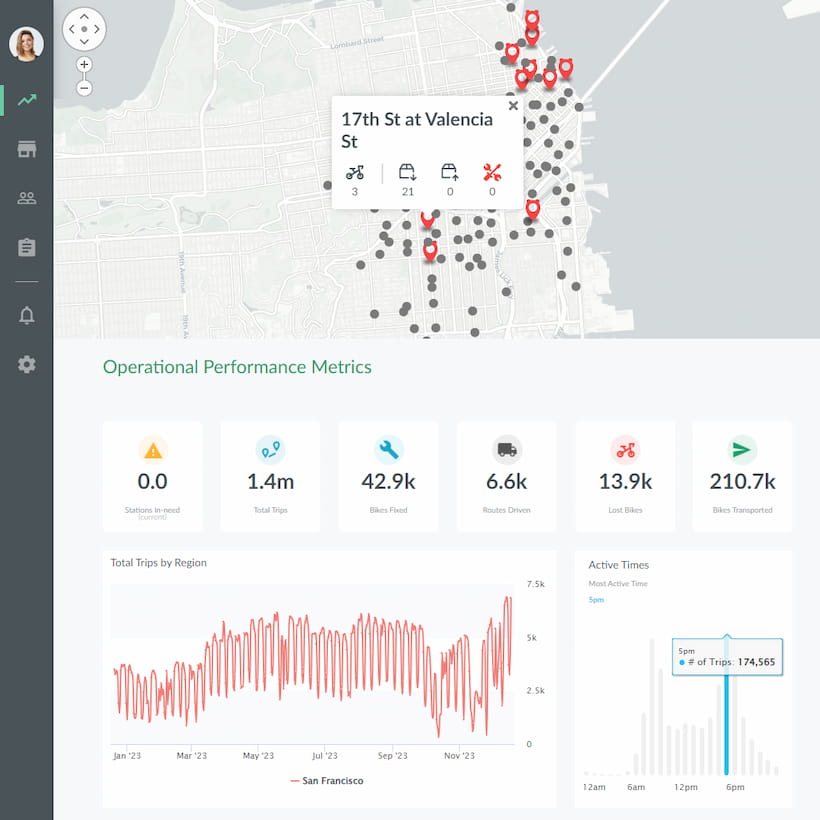
Dynamic Dashboard Real-World Examples
Machine learning capabilities power the back end of most dynamic real-time reporting tools. This makes them more insightful, intuitive, and enables business users to utilize their data as a decision-making resource. Due to their responsive nature, dynamic reporting dashboards quickly communicate information to users that enable businesses to react quickly to unexpected issues or sudden changes.
Financial Key Performance Indicator Dashboard
It is crucial to build a well-balanced combination of visuals and key performance indicators. A financial dashboard contains KPIs such as:
- Working capital
- Cash conversion cycle
- Quick ratio
- Vendor payment error rate
- Budget variance
The dynamic content provides the information needed to answer an organization’s financial queries. This includes information around invoicing, budgeting, liquidity, and financial stability. From working capital to liabilities, dynamic reporting dashboards help obtain up-to-date insight into all finance-related data. They also allow easy drill down into specific metrics.
Overall, financial interactive dashboards are beneficial for auditing the organization’s monetary status and gaining the intellect required to enhance internal processes.
Sale and Order Dashboard
Primary key performance indicators for sales and orders include:
- Total orders
- Order status
- Region-wise sales
- Perfect order rate
- Return reason
The retail industry is fast moving and highly competitive. Accessing dynamic, real-time insights is crucial to stay competitive and move along with (or preferably ahead of) the market.
A good sales and order dashboard is visually balanced, engaging, interactive, and contains all the attributes required for success, growth, and expansion in the retail sector.
The top three KPIs of the dashboard should focus on improving business fulfillment processes, efficiently managing orders, and understanding customer issues with products or services. This information enables business owners to make their organizations more efficient, productive, and highly profitable.
Why are Dynamic Dashboards Useful?
There are many reasons why businesses opt for dynamic dashboards over static dashboards.
Worldwide Access
Dynamic dashboards have a number of strengths that organizations can leverage. They typically are web-based applications that can be accessed from anywhere and from any device with internet connectivity. Everyone from the sales team to the executives can access the data they need, 24/7, from anywhere in the world.
Real-Time Information
Dynamic reporting continuously provides real-time information. This allows users to be up to date with all they need to make good decisions, whether it is sales fulfillment based on the volumes of stock in the warehouse, or human resources approving the salary for a new recruit. There’s also project information, business analytics and real-time management information.
Data-Driven Decisions
The dynamic reporting approach facilitates business decisions too. Executives and managers can confidently discuss requirements with an up-to-the-minute view of business data. The dashboard provides a clear overview of the organization with the ability to drill down as and when required. Reporting functions enable executives to make data-driven decisions.
Personalization
Typically, traditional static dashboards are run on a one-user basis for the entire organization. In other words, the dashboard presents the same data or information for all users within the organization. While this is ideal if an organization needs to display their targets for year-end, it does not help individual sales people see their own personal targets, goals, and progress.
While the solution is simple, it still requires a dynamic ability. Sales executives can access their personal sales information; however, their security settings do not allow them to access other individual’s information. In addition to their personal information, users can all see the dashboard for the year to date sales for the entire business.
One Single Source of Accurate Information
Powerful reporting tools give business owners and users a single version of the company’s data. When they extract information from various tools and manually generate a dashboard in a spreadsheet, there is a chance that the information is old, incorrect, or conflicting with other data. It might be an accidental distortion, or there might be deliberate manipulation of the content to present the project in a specific way. However, a dynamic dashboard prevents such situations since it gives a single source of information. It shows the same underlying data to everyone, even if they choose to present it differently, through specific reports or customized dashboard widgets.
Also, if data is corrected or changed, then the dashboard reflects that change automatically. There’s no outdated or conflicting information.
View What You Want, As You Want
Apart from the project information, dashboards also present business analytics and real-time management information. Since dynamic dashboards have complete access to the underlying data, changing how the data is displayed is straightforward. Everyone has different preferences for viewing business data. While business owners might like to see a long list of targets, project sponsors prefer to see data on a timeline. Dynamic dashboards allow users to experiment with a few different ways of displaying data until they find one that gives them the information they want in a meaningful and informative way.
It also allows them to save their preferences for future use. Once the users set up the tables, graphs, and reports they want to see, the contents remain. Users can adapt and change what they see in the dashboard if they need to. However, keeping a consistent view of the project allows them to compare progress over time and compare different projects quickly and more efficiently.
Allows Drill-Down
A considerable advantage a dynamic dashboard has over a static dashboard, spreadsheet, or presentation-based dashboard, is the ability to drill down into the underlying data. If users want to discover what is causing that glitch on a graph, they can click on it and dig down to the data underneath.
They can drill down to the project, or if required, they can drill further down to the task within the project. Dynamic dashboards provide everything at your fingertips, and this is a confidence builder if you’re presenting information to executives. With such clarity, it is easy to answer queries about data anomalies in the moment. On the other hand, with static dashboards, if you don’t immediately know the answer, it takes time to dig through records and check for the problem.
Interactive Insights
With features that allow users to interact with insights rather than simply viewing them on-page, a dynamic reporting dashboard provides a greater level of depth than a static or traditional reporting dashboard. With the help of automation software, it presents the most recent data in all reports.
Cohesion
As static or traditional reports present snapshots of data, it is inevitable users will gather different reports from multiple sources, causing segmentation and wasting hours filtering information. A dynamic reporting tool combines relevant data in a central location. This makes insights comparison quick and intuitive and enables rapid decision-making.
User-Friendliness
Even in today’s tech-driven world, it is likely that there will be people who do not understand how to use computers, networks, and systems correctly. Even the most well-ordered and logical file system can be an incomprehensible challenge to them.
Dynamic dashboards mean that there’s no worries about file structure, outdated reports, or how to access information. It’s intuitive for even the most tech-shy.
Digestibility
Every powerful dynamic reporting tool presents stimulating visuals set up to display well-defined KPIs. Humans respond to visual stimulation far more effectively than text-based information. This makes dashboard storytelling more effective, as users can easily view and understand data. Traditional dashboards present text-centric static data and lack interactive functionality. This means that extracting insights can be a time-consuming and labor-intensive process.
Scalability
Need more users added? No problem, just link them into their correct reporting group and they are in. Need another 100 users added? Just as easy. Need to add another whole company? No problem.
Does the marketing team want more reports displayed? No problem, reports and charts are simple to add, adjust, scale up, or scale down.
Built-In Templates and Forms
With dynamic reporting dashboards, users can connect their data sources to any existing templates. Rather than creating a new template and distributing it to multiple users, an organization can simply upload the new form to the dashboard.
Limitations of Dynamic Dashboards
Needs Secure Network Access
In the age of work-from-home, network access is a basic function that seemingly everyone has. However, there are rural areas or cities that have problematic network access, and there is always the chance of a network breach. Because a dynamic dashboard has to be stored in a shared access drive, there needs to be good internet and network access to keep information accessible—and most importantly, secure.
Data Protection
If data is online, it’s susceptible to hacking, misappropriation, and misuse. With increasing data security protocols, dynamic dashboards need to be thoroughly protected.
Manual Refresh
Most dashboards require manual refreshing. If you log in and don’t refresh, you’re more at risk of viewing outdated data.
Choosing Between Static and Dynamic Dashboards
When an organization is making a choice between a traditional static dashboard or a dynamic one, there are a number of factors they need to take into account:
Cost
The more functionality and users you have, the more a dashboard will cost to create. But it is a two-edged sword, because while the dynamic dashboard costs more than a static one, it also adds extra functionality, it saves your staff time, and delivers greater depth of insight.
Some SaaS providers allow organizations to pay per user or per report generated, allowing more customization and flexibility of cost.
Static or Dynamic Reporting
Static reports allow a user to see trends and data on a certain date or over a certain period. However, dynamic reporting is up to the minute. While some reporting tools may allow users to select dates, it’s not the default option.
This means another tool for static or historical reporting may be required.
Does Your Organization Need a Dynamic Dashboard?
If your organization is wanting to improve on metrics, but you’re not sure how or where to start, a dynamic dashboard could be the place:
- Do you collect data on a range of business information, but then it just sits there and doesn’t get used?
- Have a number of other ad-hoc solutions have been used but nothing has truly resulted in the ROI needed?
- Are your competitors moving ahead, while you flounder around?
- Does it feel like there are reports and data in a number of different locations, and they need a central location?
If any of these points are relevant to your organization, then a dynamic dashboard could be the solution. It gives the opportunity to better manage access to information to the right people, it allows users to see, in real time, the effects of their work, and provides a holistic platform for all information to be displayed.
Dynamic Dashboards with Jaspersoft
Related Resources
Jaspersoft in Action: Embedded BI Demo
See everything Jaspersoft has to offer – from creating beautiful data visualizations and dashboards to embedding them into your application.
Creating Addictive Dashboards
Learn how to build dashboards that your users will love. Turn your data into interactive, visually engaging metrics that can be embedded into your web application.