



Sales reports for senior stakeholders: From pixel-perfect output to self-service analytics

A sales report summarizes a company's sales performance over a defined period, capturing metrics such as revenue, pipeline activity, deal progression, and conversion rates. Executives and sales leaders rely on these reports to evaluate performance, track trends, determine strategy, and support forecasting and planning decisions.
However, producing a reliable sales report has become more complex. Sales data is generated across multiple systems, including customer relationship management (CRM) systems, enterprise resource planning (ERP) platforms, partner channels, and subscription models.
As a result, traditional approaches to sales reporting, which involve static dashboards and manually exported sales reports, often struggle to keep pace with how sales organizations operate today. These approaches rely on periodic snapshots and manual reconciliation, making it difficult to maintain consistency and accuracy as sales data changes across systems.
For executives to rely on sales reporting as a decision tool, reporting approaches need to adapt. Read to learn how the role of the sales report has evolved in modern organizations, how executives use pixel-perfect sales reports, and how sales reporting inside CRM and revenue platforms works in practice.
The evolving role of the sales report in modern organizations
Traditionally, organizations relied on static sales reports produced monthly or quarterly. Sales operations or finance teams manually assembled these reports for leadership review, using point-in-time data from multiple sources.
By the time reports were finalized and sent out, the underlying data was often already stale. This meant teams made decisions using incomplete or outdated information, increasing the risk of missed opportunities or unnecessary course corrections.
Ultimately, this reporting model is built around periodic review. It breaks down in organizations where leadership teams review pipeline health, forecast risk, and performance trends throughout a reporting period rather than only at month- or quarter-end.
As a result, sales reporting has shifted away from manually produced periodic summaries toward tools that continuously track data and send real-time alerts. That is why organizations increasingly expect modern sales reports to remain accurate and consistent across systems and departments and to be accessible through operational platforms where decisions are made.
Pixel-perfect sales reports for executive and board-level reporting
Pixel-perfect sales reports are built to look the same wherever teams share them, whether as a printed PDF or an interactive report online.
For executives and board members, these reports serve several purposes:
- Consistent executive and board reporting: Sales reports are often included in board decks, financial briefings, or leadership meetings where clarity and consistency are key. These reports need to maintain the same layout, structure, and metric definitions every time they are shared, so leaders can easily compare performance across quarters.
- Standardized financial and compliance reporting: Finance teams rely on sales reports that follow formats approved by finance, compliance, or leadership teams to ensure auditability and comparability. Even small changes in labeling or structure can create confusion during review, especially when teams share reports outside the sales organization.
- Reliable and repeatable report delivery: Pixel-perfect sales reports render consistently across formats and permission levels, so layouts and structure remain intact even when users have different access rights to data.
- Automated distribution to multiple stakeholders: Sales reports often need to reach different stakeholders on different schedules. Pixel-perfect reporting platforms support distributing reports at scale through automated and burst delivery, so each recipient receives the right version of the report without manual adjustments.
All in all, pixel-perfect sales reports drive smarter decisions by making critical sales information easier to access, review, and compare across reporting periods.
Sales reporting with context
CRM systems capture sales activities, including leads, opportunities, and deal status. On their own, however, they do not provide a complete picture of sales performance.
In practice, sales performance is closely tied to data from finance, operations, and other business systems. As a result, many organizations treat sales reporting as part of a broader effort to unify data across functions rather than as a standalone activity.
Reporting sits on top of this integrated data layer, bringing together CRM, financial, and operational information to provide more context, so leadership can better assess performance, understand risk, and take action.
This approach supports internal teams by allowing sales reports to reflect the full business picture, not just pipeline activity. It also supports users generating customer-facing sales reports or documents, such as statements, summaries, or performance reports, using consistent data definitions drawn from multiple systems.
Enabling self-service and ad hoc sales analysis
Besides creating and sending pixel-perfect monthly sales reports to the right people at the right time, organizations also need to give sales operations and managers room to explore data on their own. That's because these teams are often the first to spot changes in pipeline health or deal velocity.
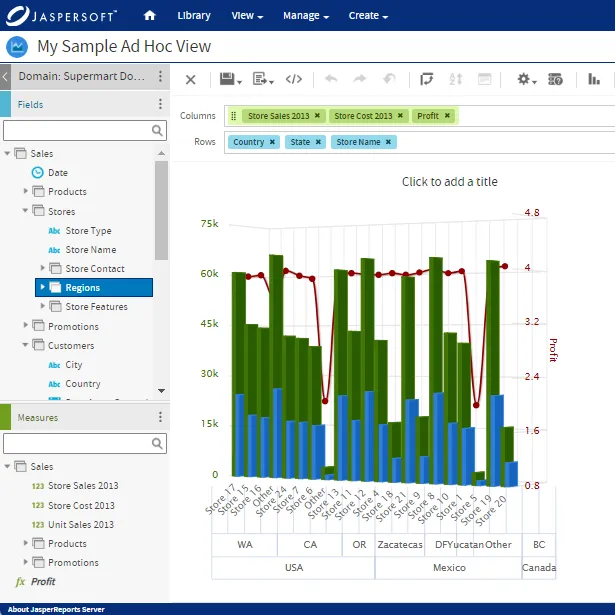
Fortunately, most pixel-perfect report platforms support self-service and ad hoc analysis. Sales teams can filter data by region, product, or time period, drill into trends, and answer follow-up questions without exporting data or asking analytics or IT teams to rebuild a report. This flexibility helps teams move faster without breaking existing reporting processes.
At the same time, self-service only works when it's paired with governed data models that define shared metrics, approved data sources, and clear access rules. Most sales report platforms let organizations establish such data models, so teams can explore sales data using the same definitions leadership relies on. That structure reduces confusion and prevents users from drifting into data they should not modify or interpret on their own.
Interactivity, defined as the ability to manipulate report views directly, plays a key role in encouraging teams to adopt self-service and ad hoc sales analysis. Filters and parameterized views allow users to adjust time periods or products on their own, so they can answer specific questions without requesting new reports from IT and analytics.
Turning sales reporting into a competitive advantage
Organizations that depend on sales reporting across multiple teams and systems need sales reports that remain governed, protected, consistent, and reliable across teams and use cases. The easier it is for teams to access accurate, up-to-date information, the more confident they will be in making timely decisions.
Jaspersoft is a reporting platform with a track record of delivering pixel-perfect documents and embedded analytics to businesses that need quick, flexible solutions without overburdening their development teams. Besides empowering clients and organizations with pixel-perfect sales reports built into existing systems, Jaspersoft supports governed self-service, allowing business users to create and explore reports within defined data and access controls.
Ready to see how Jaspersoft works? Contact us today or start your 30-day trial now.
Try Jaspersoft for free for 30 days
Efficiently design, embed, and distribute reports and dashboards at scale with Jaspersoft.
Related Resources
Pixel-perfect Reporting: What is it, and why does it matter?
Organizations often require pixel-perfect reporting to ensure the precise rendering of complex financial or regulatory documents. When it comes to pixel-perfect precision, there are very few tools like Jaspersoft that offer such granular design and can deliver these documents exactly as expected.

Ready to give it a spin?
Start your 30-day trial now.

Try Jaspersoft - Free Trial
Efficiently design, embed, and distribute reports and dashboards at scale with Jaspersoft.

Build versus Buy: An In-depth Guide
This whitepaper provides a framework for the decision-making process and critical trade-offs between building or buying an embedded BI and reporting tool.
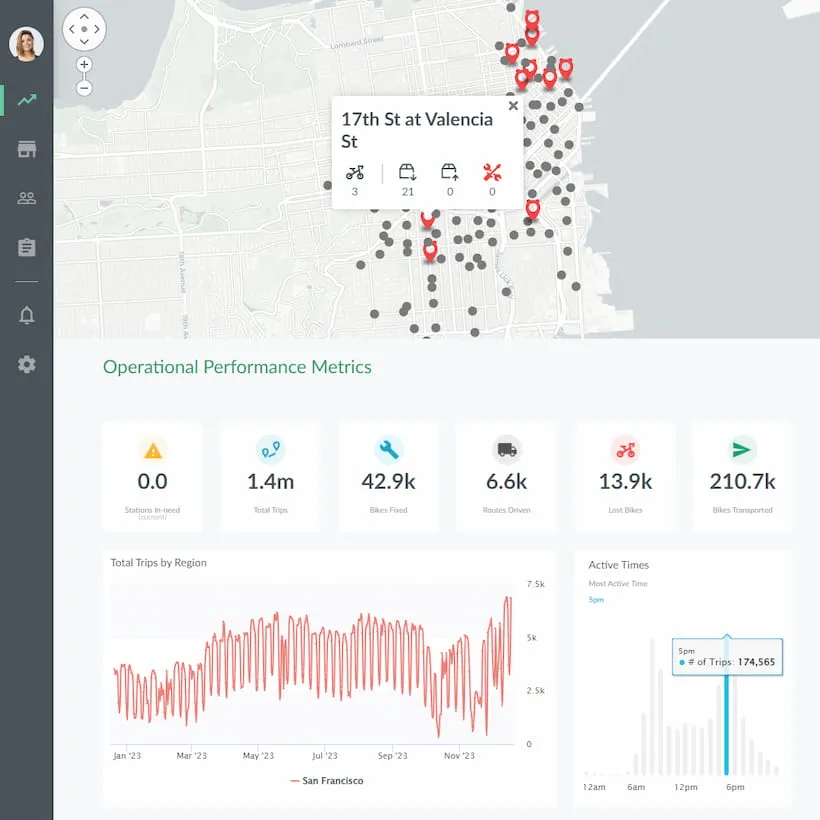
Interactive demo: Bikeshare Embedded BI, supported by Jaspersoft
Experience how to turn data into valuable insights that you and your customers can use to make better decisions.
