



Data analytics trends shaping embedded reporting and enterprise applications
Conversations around data analytics trends usually revolve around dashboards, including more ways to visualize them and how to integrate self-service tools into them. But this is only part of the picture. With trends now pointing toward more modular, API-driven reporting architectures, product managers and engineering leads need to ask a different set of questions. For instance, how do reports scale across thousands of tenants, and how do teams automate high-volume document generation without compromising security or performance? Better yet, how do they maintain consistent branding inside embedded analytics?

Advancing beyond dashboards with API-first analytics architectures
With traditional BI platforms, end users have to leave the main application and log into a separate analytics portal to access reports. That model no longer fits modern enterprise applications, especially when end users need to make business decisions based on real-time data.
As a result, embedded analytics have become a requirement for reporting. For a long time, though, embedded analytics meant dropping a dashboard widget into the host application and calling it done. And while it worked for a short period, that approach is quickly coming to an end thanks to the shift toward API-first architectures and headless BI trends.
API-first analytics give developers the ability to integrate reporting within the application. This way, reports and analytics become part of the product experience instead of a separate tool that users must learn. Additionally, custom UX for embedded analytics provided by API-first design means that the reporting architecture can adopt the look and feel of the host applications instead of a disconnected interface that feels bolted on as an afterthought. Usability and adoption of the reporting tool, consequently, increase.
The rise of composable analytics and modular reporting frameworks
Second on the list of data and analytics trends shaping embedded reporting is modularity.
Composable analytics are a direct response to a reporting problem that many product managers encounter: the build vs. buy decision. While either pathway has a downside, composable frameworks give teams modular, reusable components they can assemble into workflows without starting from scratch and without locking them into a rigid vendor interface.
As for OEMs, being composable means they can maintain and deploy report templates, data connectors, and visualization components across multiple client environments. For instance, if a financial services ISV that serves ten banks needs to generate ten reports for each institution, the reporting layer doesn’t need to rebuild the same regulatory report framework ten times. A composable architecture makes it possible to parameterize and reuse across tenants.
Read More: The Fundamentals of Visual Analytics
Operationalizing real-time data pipelines for high-volume document generation
In enterprise reporting, high-volume document generation like invoices, compliance reports, transaction summaries, and customer statements against live data is the norm. Take, for example, a financial services organization like a bank that offers Money Market Funds (MMF) that needs to generate end-of-day statements for thousands of accounts. These aren’t interactive dashboards, they’re pixel-perfect documents generated at high volume on a schedule or on demand. The data behind these documents must be current and accurate.
For this reason, real-time data pipelines continue to shape today’s data analytics trends. Real-time data pipelines keep the reporting layer connected to fresh data without the need for manual exports or batch delays. This is especially vital for regulatory reporting, which has real compliance implications. These pipelines make it possible to generate accurate time stamped documents from live operational data.
Automation is the key factor here. These real-time data pipelines trigger report generation automatically based on data events, consequently removing unnecessary human intervention from the workflows.
AI-assisted report generation and automated visualization hubs
One of the most talked-about data and analytics trends is AI and how it’s changing reporting workflows. However, while many conversations revolve around how this technology can help support predictive analytics in enterprise frameworks, its most practical contribution to enterprise reporting is reducing manual overhead in report design and distribution.
Report design has and will always be a labor-intensive process. Think formatting tables, sizing charts, aligning layouts across page sizes, and output formats. If your organization, for instance, produces hundreds or thousands of reports across departments or tenants, manually handling report design increases the overhead quickly. So much so that even a small change to a shared template can mean reworking dozens of files manually if the underlying architecture doesn’t support it.
That’s where AI comes in. Instead of manually configuring every report variation, teams can automate portions of report generation while still maintaining governance and formatting standards.
AI can also be particularly useful in environments where reporting precision matters. Pixel-perfect outputs like compliance documentation, audit records, technical manuals, and customer-facing operational reports often require strict layouts and formatting consistency. AI-assisted design tools that understand these constraints can help reduce the operational burden required to produce these documents without sacrificing accuracy.
Automated visualization hubs are also becoming more common inside embedded applications. So instead of only building static reports, organizations are creating reporting environments that dynamically surface relevant metrics, visual summaries, and operational insights based on user context.
Strengthening enterprise governance through centralized access controls
When embedded analytics environments begin to scale, a governance challenge begins to manifest. Why? Because it’s almost impossible to manage access control application by application when dozens of tenants share a single reporting infrastructure.
That’s why centralized access controls and multi-tenancy are quickly becoming the standard across enterprise reporting environments. Together, they make it easier to enforce row-level security, role-based permissions, and tenant isolation without managing separate security policies for every application.
SSO integration is also part and parcel of centralized access controls. When enterprises buy reporting tools, they expect embedded reports to respect their existing identity infrastructure. This essentially means that a developer shouldn’t have to maintain a separate authentication system for the reporting layer. It should participate in the same SSO flow as the rest of the application.
Is your team evaluating how to operationalize these data analytics trends within a production-embedded analytics architecture? Jaspersoft's embedded analytics solutions are built to meet these requirements directly — from pixel-perfect document generation and API-first integration to centralized multi-tenant governance and flexible deployment options.
Ready to give it a spin?
Start your 30-day trial now.

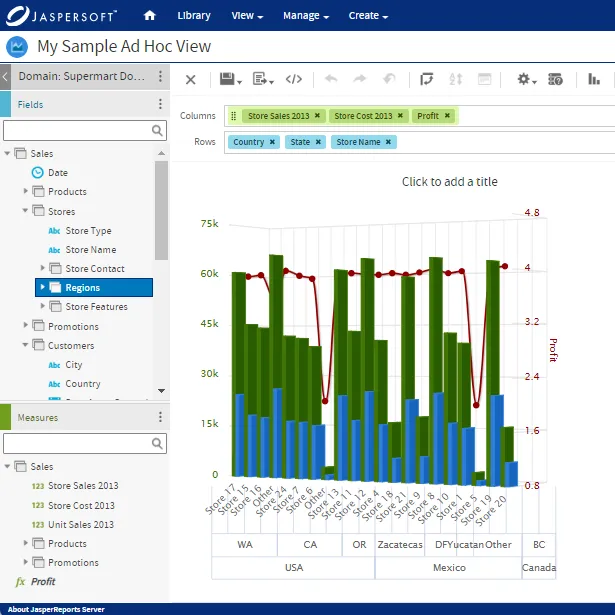
Try Jaspersoft - Free Trial
Efficiently design, embed, and distribute reports and dashboards at scale with Jaspersoft.
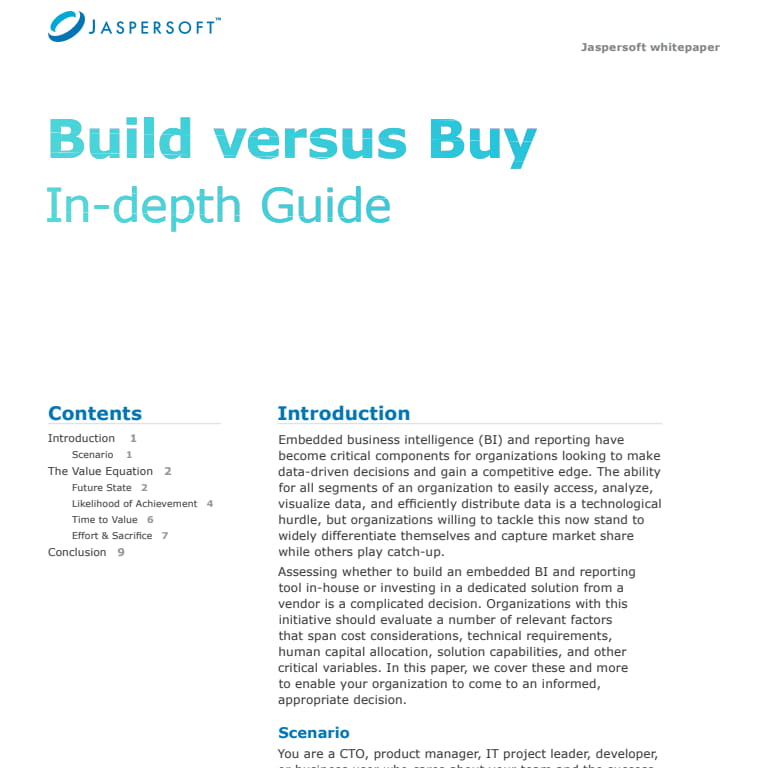
Build versus Buy: An In-depth Guide
This whitepaper provides a framework for the decision-making process and critical trade-offs between building or buying an embedded BI and reporting tool.
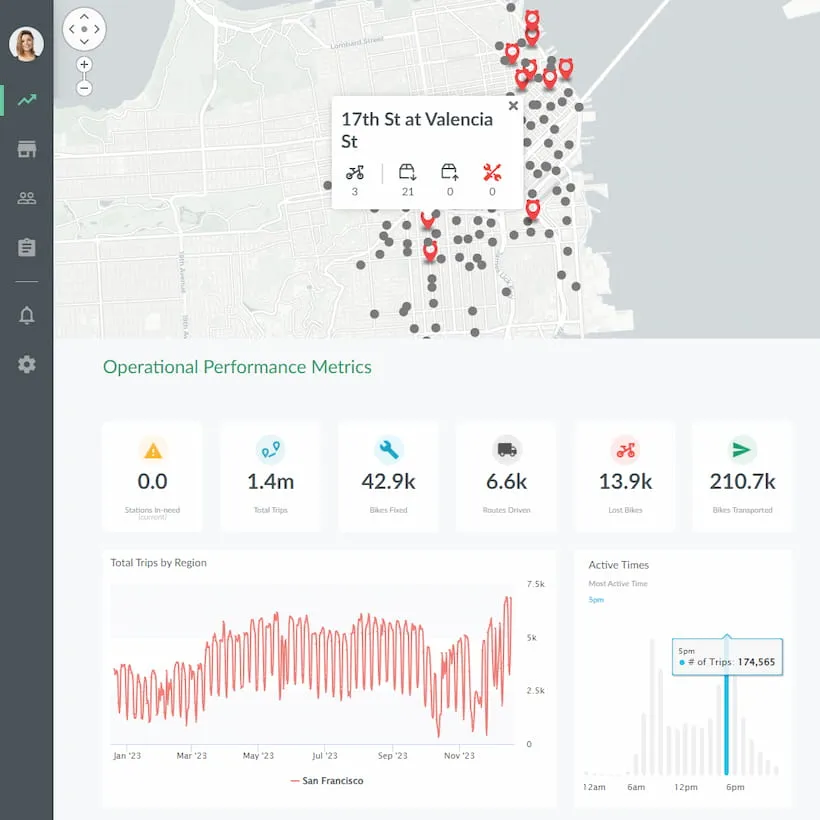
Interactive demo: Bikeshare Embedded BI, supported by Jaspersoft
Experience how to turn data into valuable insights that you and your customers can use to make better decisions.
