What is a Logarithmic Chart?
A logarithmic chart is a graphical representation that employs a logarithmic scale, diverging from the conventional linear scale used in most charts, where values are evenly spaced by creating varying intervals between values.

In contrast to the standard linear scale commonly seen in most traditional charts, a logarithmic chart employs a logarithmic scale. Unlike linear scales, which evenly space out values, logarithmic scales create varying gaps between values, resulting in notable advantages. This logarithmic approach is advantageous when dealing with datasets encompassing a wide array of values. It allows for a more streamlined and space-efficient way of presenting numerical information.
Logarithms introduce a touch of nonlinearity into the world of mathematical representation. To grasp this concept, consider the numbers 10 and 20 compared to 80 and 90. On a logarithmic scale, the intervals between these values are not uniform; instead, uniform intervals appear between numbers like 10 and 100 or 60 and 600, as they represent a consistent 100 percent increase in value.
In essence, logarithms provide an alternate method for expressing exponential equations. This approach permits the separation of the exponent on one side of an equation. For example, the equation 42 = 16 can be transformed into "log base 4 of 16 equals 2," although it's often stated as "log to the base 4 of 16 is 2." In this case, the logarithm symbolized as a log, employs a base of 4 and equals 2.
In the equation y = log base b (x), y symbolizes the exponent or power required to raise b to achieve x. This logarithmic representation is pivotal in numerous mathematical and scientific applications, providing a distinctive perspective on the connection between numbers and their exponential characteristics.
How Does The Mechanism of a Logarithmic Scale Operate?
Establishing a scale is a straightforward endeavor in the domain of linear functions. Here, one can employ integer increments where each step represents an identical, unchanging unit of measurement. This approach can be likened to marking a ruler, where the spacing between each marking consistently remains the same. However, when our focus shifts toward logarithmic functions, the scale assumes a distinct character intricately tied to the exponents by which a value is raised.
To gain a deeper insight into this, let's contemplate a linear graph characterized by a scale that increments by one. In this scenario, each step forward or backward on the graph corresponds to a change of one unit. Now, contrast this with a logarithmic graph, wherein the scale is rooted in the powers of a specific number, often taken as 10.
Consider, for instance, a hypothetical situation in which a company's sales journey commenced with a solitary sale in 1999. Remarkably, this number doubled every subsequent year until the year 2011. If we employ a linear scale in this context, it will depict the raw, absolute sales figures recorded during these years. Such a representation would illustrate a gradual increase, transitioning from a single sale in 1999 to a two-digit figure in 2000, and so forth.
However, adopting a logarithmic scale would present an entirely distinct perspective. Rather than spotlighting the raw numerical values, it would accentuate the pace of change in sales throughout this period. In this case, it would underscore that the sales figures doubled yearly. This logarithmic depiction equips us with a unique vantage point that facilitates the discernment of exponential growth patterns with exceptional clarity.
Delving into the Essentials of Logarithmic Scales
Logarithmic scales represent a potent instrument in data visualization, offering a concise and enlightening means of conveying copious volumes of information. Their applicability spans diverse fields, conferring advantages upon various organizations' analysts, researchers, and decision-makers. A firm understanding of the fundamentals of logarithmic scales is imperative to harness their potential effectively. Below, we present several key insights to bear in mind:
Semi-Logarithmic Charts:
A chart is "semi-logarithmic" when only one of its axes adopts a logarithmic scale. This approach permits a versatile portrayal of data, wherein one axis adheres to the customary linear progression while the other adheres to the logarithmic tenet. Such charts prove particularly advantageous when confronted with datasets characterized by exponential growth or decay along one axis while maintaining a linear trajectory along the other.
Log-Log Charts:
In contrast, a "log-log" chart employs logarithmic scales for both the x-axis and the y-axis. This dual logarithmic treatment proves invaluable when scrutinizing intricate relationships between variables that span multiple orders of magnitude. It can unveil intricate patterns and correlations that might remain concealed when using linear scales.
Constraints of Logarithmic Scales:
While logarithmic scales offer various benefits, they possess certain constraints. One pivotal limitation lies in their incapacity to depict negative numbers or zero. This limitation emanates from the core mathematical principle that it is inherently unattainable to derive these values by raising a base number to any exponent. Logarithmic scales are exclusively tailored for positive values, rendering them less suitable for datasets encompassing phenomena rooted in negativity or zero.
The Minimum Logarithmic Value:
Within a logarithmic scale, zero emerges as the absolute lowest conceivable value. In the realm of logarithms, this equates to an outcome of one, as any numerical entity raised to the power of zero invariably results in one. Grasping this fundamental facet of logarithmic scales is important when interpreting data structured in this particular format.
Applications Across Diverse Chart Types:
The adaptability of logarithmic scales extends to many chart types, spanning from line graphs and bar charts to pie charts and scatter plots. This versatility empowers analysts with the capability to visualize and convey data across various contexts, thereby facilitating a deeper comprehension of intricate trends and phenomena.
The Importance of Integrating Logarithmic Scales in Data Visualization
Incorporating logarithmic scales into data representation transcends mere preference; it carries significant weight in our ability to convey intricate information effectively. Logarithmic scales emerge as indispensable tools for addressing assorted visual challenges, especially in handling extensive datasets, particularly those rife with substantial value fluctuations. They ensure that critical insights are readily discernible to the audience.
Let's consider a scenario where data is presented through a bar graph. This dataset comprises numerous values, most within a relatively narrow range, while a select few exhibit significantly elevated values. When plotted on a linear scale, these disparities in magnitude can create formidable obstacles for viewers striving to extract insights from the chart.
Logarithmic scales remedy this dilemma by reshaping the visual portrayal of data. Here's why they hold significance:
Equalizing Visual Impact:
Logarithmic scales compress larger values and expand smaller ones. This compression and expansion effect levels the visual playing field for data points across the chart, facilitating the differentiation between values of varying magnitudes. Consequently, viewers can grasp the full spectrum of data without the distraction of disproportionately prominent outliers.
Clarity Amidst Complexity:
Logarithmic scales in datasets marked by extensive variations introduce structure to what might otherwise be chaotic. They arrange the information in a manner that upholds the integrity of each data point while curbing the dominance of a few exceptional outliers. Such organization is vital in scientific research, financial analysis, and other domains where precision and subtlety are paramount.
Facilitating Informed Decision-Making:
The adoption of logarithmic scales fosters informed decision-making. By eliminating the distortions caused by extreme values, decision-makers can formulate sound judgments grounded in a more accurate data representation. Logarithmic scales enhance the likelihood of making sound decisions, whether assessing market trends, scrutinizing scientific phenomena, or any other field reliant on data-driven insights.
Elevating Data Communication:
Logarithmic scales amplify the communicative prowess of charts and graphs. They empower data analysts and researchers to succinctly and comprehensibly convey intricate information. This proves particularly advantageous when presenting findings to diverse audiences with varying numerical acumen levels.
Mastering the Potency of the Logarithmic Formula
Harnessing the potential residing within logarithmic scales transcends a mere numerical exercise; it is a fundamental skill that empowers you to navigate through extensive datasets easily and decipher complex exponential connections. To adeptly employ the logarithmic formula—y = log₁₀(x)—and unravel the subtleties woven into logarithmic scales, adhere to these strategic steps:
Substitution of the y-Variable:
Logarithms, in essence, offer a streamlined avenue for unraveling intricate exponential functions. Begin by identifying the base, often 10, and discern the role played by the y-variable in your specific context. Armed with this understanding, embark on the journey to compute the function and unveil the secrets of the x-variable. For instance, imagine you're tasked with graphing a logarithmic function, and it yields a y-value of 1,500. Implement this value into the formula as illustrated below:
1,500 = log₁₀(x)
Computation of the Logarithmic Function:
To unearth the elusive x-variable, your next step involves solving the logarithmic function using algebraic prowess. Reflecting on our earlier example with a y-value of 1,500, shift your perspective towards an exponential function and execute the calculation as follows:
10^x = 1,500
By resolving for the x-value, you'll hold the key to defining the scale for your graph.
Determination of the x-Variable:
With the groundwork meticulously laid, it's now time to deduce the x-variable. This variable essentially dictates the increment by which each step on your logarithmic scale advances or regresses. Returning to our previous example, solving the equation 10^x = 1,500 yields an x-value of approximately 3.18. This implies that for every incremental change in the y-value, the corresponding x-value undergoes a tenfold increase with the previous x-value. To illustrate further, should the y-value surpass 1,501, the x-value will ascend to roughly 31.76.
This three-fold process allows you to proficiently wield the logarithmic formula, decode intricate exponential relationships, construct meaningful scales, and confidently traverse intricate datasets. Whether your endeavors revolve around scientific exploration, financial modeling, or any discipline that demands precision and insight, mastery of the logarithmic formula equips you with a formidable tool for deciphering the dynamics of numerical data.
The Importance of Embracing Logarithmic Scales
Logarithmic scales, a foundational tool in data representation, provide a distinctive means to account for the intricate variations present in a wide array of phenomena. Here's why individuals turn to logarithmic scales to gain insight into the complexities of the world around us:
Sensitivity to Change:
Our world seldom experiences changes in uniform increments. Take temperature as an example. Consider the distinction between 60 and 65 degrees; it's hardly noticeable. In contrast, the gap between 105 degrees and 110 degrees is palpable. Although these temperature shifts may appear linear when placed on a scale, our perception of them is far from linear. Logarithmic scales enable us to accurately capture these discernible differences by compressing larger values and expanding smaller ones. They provide a representation of data that aligns with our innate sense of change, rendering it more relatable and intuitive.
The Richter Scale:
The Richter scale, a tool employed to gauge earthquake magnitudes, is a classic illustration of logarithmic scales. Those with experience in seismic events understand that distinguishing between a magnitude 2.5 and 3.5 earthquake is challenging, whereas a one-unit difference between 5.5 and 6.5 is unmistakable. The Richter scale unveils the true nature of seismic energy release, where each whole number increment signifies not a linear but a tenfold amplification in amplitude. This amplification of change at higher levels underscores the indispensability of logarithmic scales in comprehending seismic activity.
Decibel Measurements:
Logarithmic scales hold a central position in the realm of sound. Decibel measurements, frequently utilized in acoustics, audio engineering, and telecommunications, express sound intensity and power ratios in a logarithmic fashion. This approach enables us to navigate the extensive range of human auditory perception, encompassing the spectrum from barely audible whispers to thunderously loud sounds. It does so in a manner that mirrors our auditory sensitivity.
Star Brightness and Moore's Law:
Logarithmic scales shine brightly in astronomy, where they assist in quantifying the luminosity of celestial objects. The magnitude system, rooted in logarithmic principles, permits astronomers to classify stars based on their brightness. Similarly, Moore's Law, a renowned observation in the computing domain, reflects exponential growth in the number of transistors on integrated circuits—a concept firmly grounded in logarithmic progression.
pH Balance:
In chemistry, pH balance is a metric for assessing the concentration of hydrogen ions in a solution. It is evaluated on a logarithmic scale spanning from 0 to 14. Each unit change on the pH scale signifies a tenfold alteration in hydrogen ion concentration—a fundamental aspect of comprehending the acidity or alkalinity of a substance.
Unlocking the Potential of Logarithmic Scales: When and Where to Apply Them
Logarithmic scales, a formidable asset in data visualization, step into the spotlight when confronted with datasets characterized by vast disparities in magnitude. These scales offer distinctive advantages, particularly when visualizing substantial percentage variations or representing data that adheres to exponential growth patterns. Let's delve deeper into the scenarios and the domains in which logarithmic scales should be strategically employed:
Navigating Disparate Data Magnitudes:
Logarithmic scales shine in situations where data values sprawl across multiple orders of magnitude. They come to the forefront when tackling data that does not conform to an even distribution—instances where a handful of data points significantly exceed or fall well short of the majority. Picture, for instance, a chart illustrating the profits of 100 department store branches. If two or three branches remarkably outperform the rest, adopting a linear scale may squish the data of the remaining 98 branches, thereby obscuring discernible trends. Enter logarithmic scales, gracefully resolving this quandary and allowing for a more equitable depiction of the complete dataset.
Visualizing Percentage Shifts and Multiplicative Factors:
Logarithmic scales demonstrate their prowess in capturing percentage fluctuations and multiplicative factors. Consider the case of a store that starts by selling one product in the first year, doubling its sales every subsequent year. A conventional linear chart might depict an extended phase of gradual growth followed by a sudden spike. However, a logarithmic scale paints a more authentic picture, portraying a consistent doubling each year as a straightforward line from the lower-left corner to the upper-right corner. This representation accurately mirrors the exponential nature of the data, rendering it a prime choice for such scenarios.
Fields Embracing Logarithmic Scales:
Numerous fields routinely harness logarithmic scales' capabilities to address various challenges. Here are some noteworthy examples:
- Actuarial Science: Actuaries lean on logarithmic scales to compute insurance metrics, evaluate costs, and scrutinize risks, particularly when confronted with extensive datasets.
- Medicine: Medical practitioners frequently turn to logarithmic scales in nuclear and internal medicine, especially for measurements relating to pH concentrations, radioactive decay, health dynamics, and bacterial proliferation.
- Archaeology: Archaeologists employ logarithmic functions to determine the ages of ancient artifacts, plants, and fibers by analyzing carbon isotopes.
- Mathematics: Logarithmic scales serve as foundational tools in statistics and analytics, particularly when grappling with problems grounded in exponential equations.
- Finance: Financial experts leverage logarithmic increments to convey interest rates effectively, spotlighting the growth of investments or elucidating the financial standing of individuals or groups.
Selecting the Appropriate Charts for Logarithmic Scales
Choosing the right chart type to complement logarithmic scales is pivotal in ensuring effective data visualization. Not all chart types harmonize effortlessly with logarithmic scales, primarily because precise length assessments become essential. However, several chart options seamlessly align with logarithmic scales, each bringing unique strengths. Let's delve into the chart types that synergize smoothly with logarithmic scales and highlight their distinctive advantages:
Dot Charts:
Dot charts offer a compelling alternative to traditional bar charts operating within logarithmic scales. They possess a significant advantage in terms of clarity. In contrast to bar charts, where the length of bars serves as a visual representation of values, dot charts employ discrete dots that don't inherently convey a specific value. This characteristic harmonizes perfectly with the principles underpinning logarithmic scales. Dot charts can be deployed in both horizontal and vertical orientations, endowing them with versatility in data representation. Their uncluttered appearance greatly facilitates the precise depiction of values, particularly when applied to logarithmic scales.
Line Charts:
Line charts emerge as a dependable choice when visualizing data on logarithmic scales. Their innate capacity to illustrate trends and patterns makes them exceptionally well-suited for logarithmic charts. The smooth, continuous lines featured in these charts excel at unveiling the exponential growth or decay inherent in logarithmic data. Whether monitoring financial performance, scrutinizing scientific phenomena, or handling any dataset characterized by exponential attributes, line charts furnish an insightful and intuitive means of conveying information.
Specialized Stock and Share Charts:
Specialized stock and share charts prove indispensable for individuals engaged in financial analysis and share trading endeavors. These encompass candlestick charts, Kagi charts, Renko charts, and others. These charts transcend mere data point depiction; they provide comprehensive insights into buy and sell prices, price trends, and market sentiment revolving around specific shares. Although not exclusively designed for logarithmic scales, they seamlessly complement logarithmic scale charts, particularly when dissecting stock and share trends.
Pros and Cons of Logarithmic Charts: Balancing Insights and Limitations
Logarithmic charts stand as invaluable assets in data visualization, offering distinctive advantages and limitations that warrant careful consideration when opting for them as a representation method. Below, we delve into the strengths and weaknesses of logarithmic charts to gain a comprehensive grasp of their utility.
Advantages of Logarithmic Charts:
Enhanced Trend Visibility:
Logarithmic charts excel at making trends more pronounced and discernible. By faithfully reflecting the underlying data, they simplify the identification of trends with remarkable precision. When trend lines are superimposed on a logarithmic chart, the disparity between it and a linear chart becomes glaringly apparent. Logarithmic charts often provide a more faithful depiction of trends, especially when dealing with exponential growth or decline datasets.
Long-Term Perspective:
Long-term perspectives typically span extended durations marked by substantial fluctuations and growth. Logarithmic scales adeptly capture these dynamic trajectories. On a linear scale, these protracted periods of transformation may appear compressed and lacking clarity, while logarithmic scales gracefully accommodate the sweeping changes often observed in long-term data.
Accommodation of a Wide Data Range:
Logarithmic scales surmount the challenge posed by outliers within data. Outliers can exert pressure on most data points when plotted on a linear scale, potentially rendering them less discernible. Logarithmic scales effectively address this issue, ensuring that individual data points maintain visibility and are not overshadowed by extreme values. This makes them an excellent choice when handling datasets characterized by diverse ranges.
Drawbacks of Logarithmic Charts:
Absence of an Absolute Zero:
A noteworthy limitation of logarithmic scales is their absence of an absolute zero point. Given that a value cannot be raised to the power of zero in logarithmic terms, logarithmic charts cannot initiate from zero. While this limitation may not present issues for certain types of data, it necessitates careful consideration by chart creators. The absence of a zero point could confuse viewers not well-versed in logarithmic scales.
Complex Interpretation:
Logarithmic charts are not tailored to provide explicit numerical values but to underscore trends. This aspect can render them challenging to interpret for individuals expecting precise numerical figures. Viewers must understand the scale's logarithmic nature to effectively analyze logarithmic charts, which might require supplementary explanations and labeling on the chart itself.
Incompatibility with Negative Values:
Logarithmic charts are less suitable for plotting positive and negative numbers on the same scale. Logarithmic functions inherently lack solutions for negative values, which limits their applicability in scenarios where the visualization of both positive and negative values is required.
Logarithmic charts emerge as potent assets in data visualization, offering distinct advantages that become especially valuable when grappling with datasets characterized by substantial variations in magnitude or exponential growth trends. Their remarkable capacity to amplify trend visibility, facilitate the analysis of long-term perspectives, and shed light on the influence of outliers renders them indispensable tools across diverse domains, ranging from finance's intricacies to scientific research's frontiers.
Nonetheless, it's imperative to recognize the inherent limitations of logarithmic charts. These include the absence of an absolute zero point, the requisite comprehension of their logarithmic nature by viewers, and their unsuitability for visualizing negative values. To fully harness the potential embedded within logarithmic charts, meticulous consideration of the data's inherent characteristics and the precise objectives of the visualization endeavor is paramount.
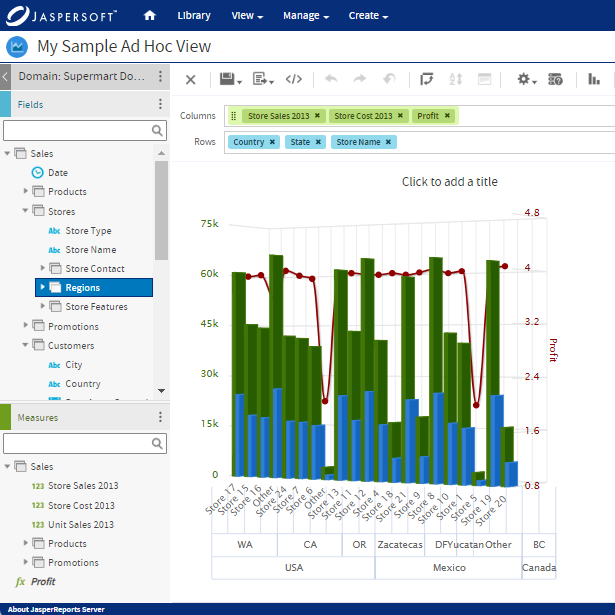
Logarithmic Charts with Jaspersoft
Related Resources
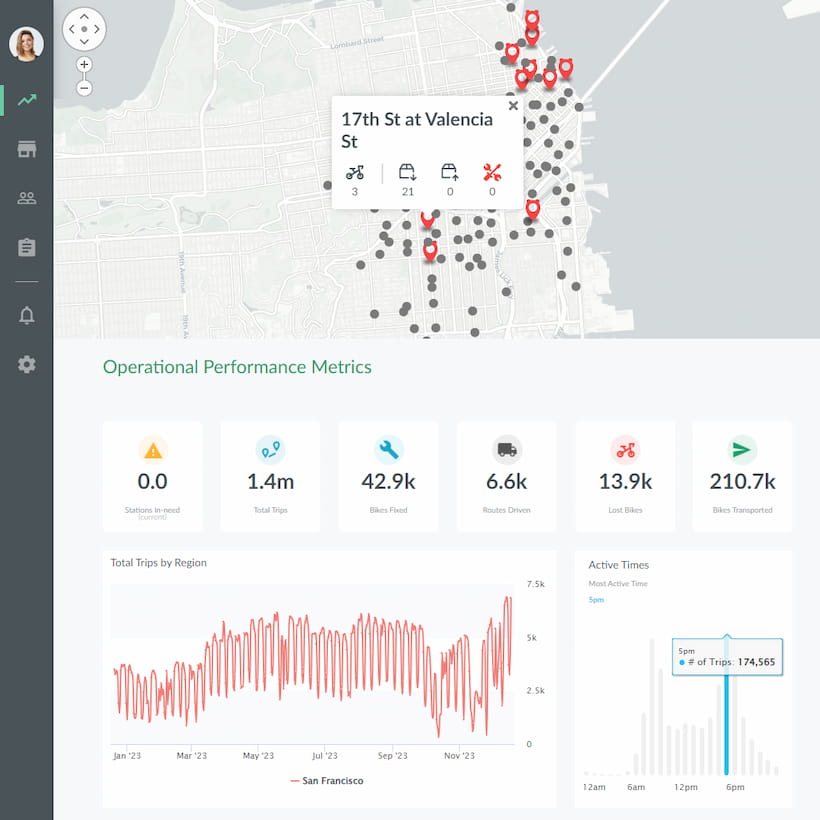
Jaspersoft in Action: Embedded BI Demo
See everything Jaspersoft has to offer – from creating beautiful data visualizations and dashboards to embedding them into your application.
Creating Addictive Dashboards
Learn how to build dashboards that your users will love. Turn your data into interactive, visually engaging metrics that can be embedded into your web application.